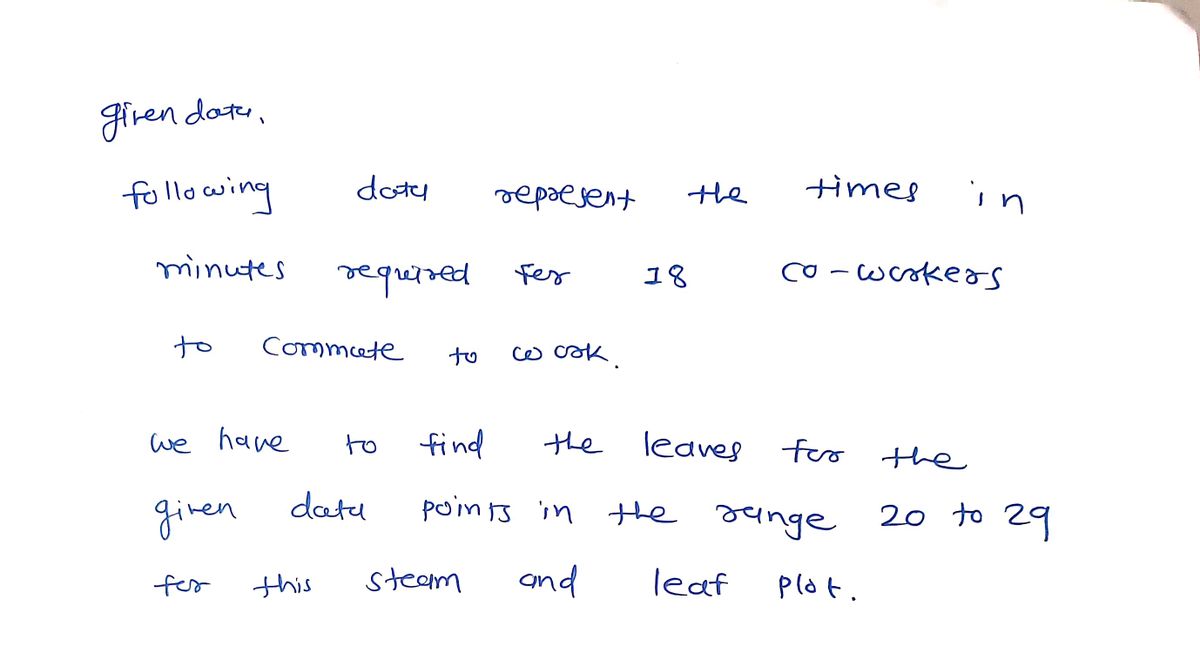
The following data represent the times in minutes required for 18 co-workers to commute to work. V Determine the leaves for the given data points in the range 20 to 29 for this stem-and-leaf plot. Answer 2 Points 44 16 20 10 10 14 35 41 37 18 32 38 26 37 34 17 37 39 Selecting a stem will display the leaves necessary to complete the answer. Not all boxes may be used. Commute Times in Minutes Leaves Stem 01 68
The following data represent the times in minutes required for 18 co-workers to commute to work. V Determine the leaves for the given data points in the range 20 to 29 for this stem-and-leaf plot. Answer 2 Points 44 16 20 10 10 14 35 41 37 18 32 38 26 37 34 17 37 39 Selecting a stem will display the leaves necessary to complete the answer. Not all boxes may be used. Commute Times in Minutes Leaves Stem 01 68
MATLAB: An Introduction with Applications
6th Edition
ISBN:9781119256830
Author:Amos Gilat
Publisher:Amos Gilat
Chapter1: Starting With Matlab
Section: Chapter Questions
Problem 1P
Related questions
Question

Transcribed Image Text:The following data represent the times in minutes required for 18 co-workers to commute to work.
<
Prev
esc
Determine the leaves for the given data points in the range 20 to 29 for this stem-and-leaf plot.
Answer 2 Points
Selecting a stem will display the leaves necessary to complete the answer. Not all boxes may be used.
Commute Times in Minutes
Leaves
©2022 Hawkes Learning
!
1
9
a
←
@
2
W
S
w#
3
e
Stem
01
02
d
03.
04
C
$
4
r
f
N
%
5
t
44 16 20 10 10 14
35 41 37 18 32 38
26 37 34 17 37 39
g
Oll
6
y
&
7
h
O
u
*00
8
j
O
(
9
k
✓
)
0
➡

Transcribed Image Text:<
Prev
esc
Determine the leaves for the given data points in the range 20 to 29 for this stem-and-leaf plot.
Answer 2 Points
Selecting a stem will display the leaves necessary to complete the answer. Not all boxes may be used.
Commute Times in Minutes
Leaves
Ⓒ2022 Hawkes Learning
!
1
q
@
2
W
#3
e
Stem
01
02
03
04
C
54
$
O
44 16 20 10 10 14
35 41 37 18 32 38
26 37 34 17 37 39
%
5
t
Oll
6
y
&
7
O
*
8
O
9
✓
O
Expert Solution
Step 1

Step by step
Solved in 2 steps with 2 images

Recommended textbooks for you

MATLAB: An Introduction with Applications
Statistics
ISBN:
9781119256830
Author:
Amos Gilat
Publisher:
John Wiley & Sons Inc

Probability and Statistics for Engineering and th…
Statistics
ISBN:
9781305251809
Author:
Jay L. Devore
Publisher:
Cengage Learning

Statistics for The Behavioral Sciences (MindTap C…
Statistics
ISBN:
9781305504912
Author:
Frederick J Gravetter, Larry B. Wallnau
Publisher:
Cengage Learning

MATLAB: An Introduction with Applications
Statistics
ISBN:
9781119256830
Author:
Amos Gilat
Publisher:
John Wiley & Sons Inc

Probability and Statistics for Engineering and th…
Statistics
ISBN:
9781305251809
Author:
Jay L. Devore
Publisher:
Cengage Learning

Statistics for The Behavioral Sciences (MindTap C…
Statistics
ISBN:
9781305504912
Author:
Frederick J Gravetter, Larry B. Wallnau
Publisher:
Cengage Learning

Elementary Statistics: Picturing the World (7th E…
Statistics
ISBN:
9780134683416
Author:
Ron Larson, Betsy Farber
Publisher:
PEARSON

The Basic Practice of Statistics
Statistics
ISBN:
9781319042578
Author:
David S. Moore, William I. Notz, Michael A. Fligner
Publisher:
W. H. Freeman

Introduction to the Practice of Statistics
Statistics
ISBN:
9781319013387
Author:
David S. Moore, George P. McCabe, Bruce A. Craig
Publisher:
W. H. Freeman