The following data represent glucose blood levels (mg/100 ml) after a 12-hour fast for a random sample of 70 women (Reference: American Journal of Clinical Nutrition, Vol. 19, pp. 345-351). (e) Categorize the basic distribution shape. (options below) uniform skewed left mound-shaped symmetrical bimodal skewed right (f) Draw an ogive.
The following data represent glucose blood levels (mg/100 ml) after a 12-hour fast for a random sample of 70 women (Reference: American Journal of Clinical Nutrition, Vol. 19, pp. 345-351). (e) Categorize the basic distribution shape. (options below) uniform skewed left mound-shaped symmetrical bimodal skewed right (f) Draw an ogive.

MATLAB: An Introduction with Applications
6th Edition
ISBN:9781119256830
Author:Amos Gilat
Publisher:Amos Gilat
Chapter1: Starting With Matlab
Section: Chapter Questions
Problem 1P

Related questions
Topic Video
Question
The following data represent glucose blood levels (mg/100 ml) after a 12-hour fast for a random sample of 70 women (Reference: American Journal of Clinical Nutrition, Vol. 19, pp. 345-351).
(e) Categorize the basic distribution shape. (options below)
uniform
skewed left
mound-shaped symmetrical
bimodal
skewed right
(f) Draw an ogive.

Transcribed Image Text:The following data represent glucose blood levels (mg/100 ml) after a 12-hour fast for a random sample of 70 women (Reference: American Journal of Clinical Nutrition, Vol. 19, pp. 345-351).
45
66
83
71
76
64 59
59 76 82
80 81
85 77
82 90 87
72 79 69
83
71
87
69
81
76
96
83 67
94
101
94
89
94
73
99
93
85 83
80
78 80
85
83
84
74 81
70 65
89
70 80
84
77
65 46
80
70 75 45
101
71
109 73 73 80 72
81 63 74
For this problem, use six classes.
Expert Solution
Step 1
Given Information:
The data represents glucose blood levels (mg/100 ml) after a 12-hour fast for a random sample of 70 women:
To categorize the distribution of shape:
Construct a Histogram for the given data as follows:
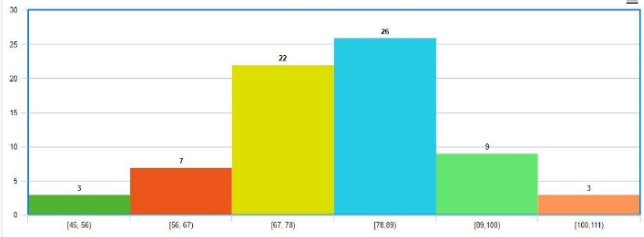
The distribution of the shape is mound-shaped symmetrical.

Trending now
This is a popular solution!

Step by step
Solved in 2 steps with 2 images

Knowledge Booster


Learn more about
Need a deep-dive on the concept behind this application? Look no further. Learn more about this topic, statistics and related others by exploring similar questions and additional content below.Recommended textbooks for you
MATLAB: An Introduction with Applications
Statistics
ISBN:
9781119256830
Author:
Amos Gilat
Publisher:
John Wiley & Sons Inc

Probability and Statistics for Engineering and th…
Statistics
ISBN:
9781305251809
Author:
Jay L. Devore
Publisher:
Cengage Learning

Statistics for The Behavioral Sciences (MindTap C…
Statistics
ISBN:
9781305504912
Author:
Frederick J Gravetter, Larry B. Wallnau
Publisher:
Cengage Learning
MATLAB: An Introduction with Applications
Statistics
ISBN:
9781119256830
Author:
Amos Gilat
Publisher:
John Wiley & Sons Inc
Probability and Statistics for Engineering and th…
Statistics
ISBN:
9781305251809
Author:
Jay L. Devore
Publisher:
Cengage Learning
Statistics for The Behavioral Sciences (MindTap C…
Statistics
ISBN:
9781305504912
Author:
Frederick J Gravetter, Larry B. Wallnau
Publisher:
Cengage Learning

Elementary Statistics: Picturing the World (7th E…
Statistics
ISBN:
9780134683416
Author:
Ron Larson, Betsy Farber
Publisher:
PEARSON

The Basic Practice of Statistics
Statistics
ISBN:
9781319042578
Author:
David S. Moore, William I. Notz, Michael A. Fligner
Publisher:
W. H. Freeman

Introduction to the Practice of Statistics
Statistics
ISBN:
9781319013387
Author:
David S. Moore, George P. McCabe, Bruce A. Craig
Publisher:
W. H. Freeman