The file FDICBankFailures contains data on failures of federally insured banks between 2000 and 2012. Create a PivotTable in Excel to answer the following questions. The PivotTable should group the closing dates of the banks into yearly bins and display the counts of bank closures each year in columns of Excel. Row labels should include the bank locations and allow for grouping the locations into states or viewing by city. You should also sort the PivotTable so that the states with the greatest number of total bank failures between 2000 and 2012 appear at the top of the PivotTable. Click on the datafile logo to reference the data. (a) Which state had the greatest number of federally insured bank closings between 2000 and 2012? - Select your answer - (b) How many bank closings occurred in the state of Nevada (NV) in 2010? In what cities did these bank closings occur? - Select your answer - (c) Use the PivotTable’s filter capability to view only bank closings in California (CA), Florida (FL), Texas (TX), and New York (NY) for the years 2009 through 2012. What is the total number of bank closings in these states between 2009 and 2012?


The file FDICBankFailures contains data on failures of federally insured banks between 2000 and 2012. Create a PivotTable in Excel to answer the following questions. The PivotTable should group the closing dates of the banks into yearly bins and display the counts of bank closures each year in columns of Excel. Row labels should include the bank locations and allow for grouping the locations into states or viewing by city. You should also sort the PivotTable so that the states with the greatest number of total bank failures between 2000 and 2012 appear at the top of the PivotTable.
Click on the datafile logo to reference the data.
(a) Which state had the greatest number of federally insured bank closings between 2000 and 2012?
- Select your answer -
(b) How many bank closings occurred in the state of Nevada (NV) in 2010?
In what cities did these bank closings occur?
- Select your answer -
(c) Use the PivotTable’s filter capability to view only bank closings in California (CA), Florida (FL), Texas (TX), and New York (NY) for the years 2009 through 2012. What is the total number of bank closings in these states between 2009 and 2012?
Given
The answer is given below.
To make Pivot Table,follow the below MS Excel procedure:
Step1: From the main ribbon select insert
step2: Select Pivot Table The dialog box"create pivot table"will appear.
step3:Select the total range of data.
step4:Select new worksheet option and then click ok.
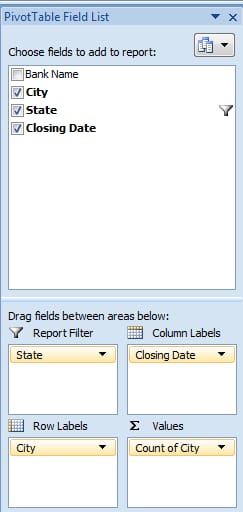
step5:Drag the column labels and summation values below.

Trending now
This is a popular solution!

Step by step
Solved in 2 steps with 4 images


