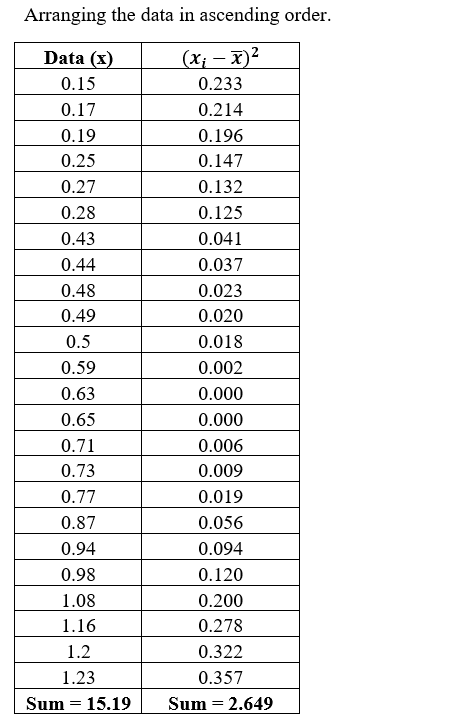
The FDA regulates that fish that are consumed should contain no more than 1.0 mg/kg of mercury. In Florida, bass fish were collected in 24 different lakes to measure the amount of mercury in the fish (Multi- disciplinary niser activity, 2013). The data for the average amount of mercury in the fish from each lake is in table below. Average mercury level in a lake 0.71 0.15 0.17 0.63 0.43 1.08 0.27 0.5 0.19 1.20 0.94 0.87 0.48 0.44 0.98 0.59 0.28 0.49 1.16 0.25 1.23 0.77 0.73 0.65 For the data shown above, find the following. Round values 3 decimal place (s). Select the correct units for each statistic.
The FDA regulates that fish that are consumed should contain no more than 1.0 mg/kg of mercury. In Florida, bass fish were collected in 24 different lakes to measure the amount of mercury in the fish (Multi- disciplinary niser activity, 2013). The data for the average amount of mercury in the fish from each lake is in table below. Average mercury level in a lake 0.71 0.15 0.17 0.63 0.43 1.08 0.27 0.5 0.19 1.20 0.94 0.87 0.48 0.44 0.98 0.59 0.28 0.49 1.16 0.25 1.23 0.77 0.73 0.65 For the data shown above, find the following. Round values 3 decimal place (s). Select the correct units for each statistic.

MATLAB: An Introduction with Applications
6th Edition
ISBN:9781119256830
Author:Amos Gilat
Publisher:Amos Gilat
Chapter1: Starting With Matlab
Section: Chapter Questions
Problem 1P

Related questions
Question

Transcribed Image Text:For the data shown above, find the following. Round values 3 decimal place (s). Select the correct units for
each statistic.
. Find the mean:
. Find the median:
. Find the range:
. Find the variance:
. Find the standard deviation:
Select an answer
Select an answer ✓
Select an answer ✓
Select an answer
Select an answer ✓

Transcribed Image Text:The FDA regulates that fish that are consumed should contain no more than 1.0 mg/kg of mercury. In
Florida, bass fish were collected in 24 different lakes to measure the amount of mercury in the fish ('Multi-
disciplinary niser activity, 2013). The data for the average amount of mercury in the fish from each lake is
in table below.
Average mercury level in a lake
0.71
0.15
0.17
0.63
0.43
1.08
0.27
0.5
0.19
1.20
0.94
0.87
0.48
0.44
0.98
0.59
0.28
0.49
1.16
0.25
1.23
0.77
0.73
0.65
For the data shown above, find the following. Round values 3 decimal place (s). Select the correct units for
each statistic.
Expert Solution
Step 1
Given information-
We have given the data on the average mercury level in the lake.

Step by step
Solved in 2 steps with 2 images

Recommended textbooks for you
MATLAB: An Introduction with Applications
Statistics
ISBN:
9781119256830
Author:
Amos Gilat
Publisher:
John Wiley & Sons Inc

Probability and Statistics for Engineering and th…
Statistics
ISBN:
9781305251809
Author:
Jay L. Devore
Publisher:
Cengage Learning

Statistics for The Behavioral Sciences (MindTap C…
Statistics
ISBN:
9781305504912
Author:
Frederick J Gravetter, Larry B. Wallnau
Publisher:
Cengage Learning
MATLAB: An Introduction with Applications
Statistics
ISBN:
9781119256830
Author:
Amos Gilat
Publisher:
John Wiley & Sons Inc
Probability and Statistics for Engineering and th…
Statistics
ISBN:
9781305251809
Author:
Jay L. Devore
Publisher:
Cengage Learning
Statistics for The Behavioral Sciences (MindTap C…
Statistics
ISBN:
9781305504912
Author:
Frederick J Gravetter, Larry B. Wallnau
Publisher:
Cengage Learning

Elementary Statistics: Picturing the World (7th E…
Statistics
ISBN:
9780134683416
Author:
Ron Larson, Betsy Farber
Publisher:
PEARSON

The Basic Practice of Statistics
Statistics
ISBN:
9781319042578
Author:
David S. Moore, William I. Notz, Michael A. Fligner
Publisher:
W. H. Freeman

Introduction to the Practice of Statistics
Statistics
ISBN:
9781319013387
Author:
David S. Moore, George P. McCabe, Bruce A. Craig
Publisher:
W. H. Freeman