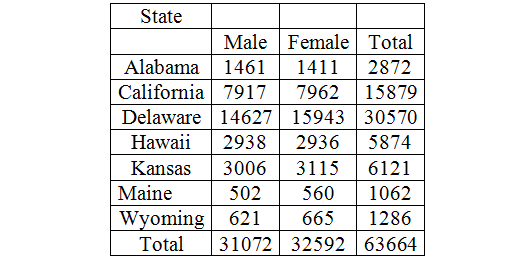
The data in the attached table shows the number of poodles in seven different states. An analysis of the data included identifying the number of male and female poodles per state. The results are given. Test for an association between sex and poodles for the seven states listed. What do you conclude at the 5% significance level? What do you conclude at the 1% confidence level? Make sure you show all the steps. Can we conclude at the 5% significance level, that male poodles are equally distributed among the seven states? Make sure you show all the steps


The data in the attached table shows the number of poodles in seven different states. An analysis of the data included identifying the number of male and female poodles per state. The results are given.
- Test for an association between sex and poodles for the seven states listed. What do you conclude at the 5% significance level? What do you conclude at the 1% confidence level? Make sure you show all the steps.
- Can we conclude at the 5% significance level, that male poodles are equally distributed among the seven states? Make sure you show all the steps

(1)
State the hypotheses.
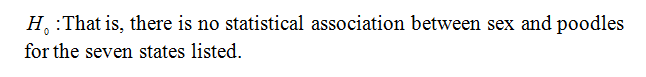
Null hypothesis:
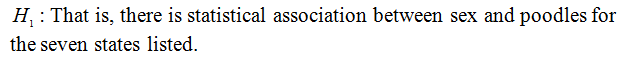
Alternative hypothesis:
Obtain the value of the test statistic.
From the information, given that
EXCEL (PHStat in Add-Ins) procedure:
Step 1: Choose PH Stat > Multiple-Sample Tests > Chi-Square Test.
Step 2: In Data, enter the values of Level of Significance as 0.05, Number of Rows as 7, and Number of Columns as 2.
Step 3: Click OK.
EXCEL (PHStat in Add-Ins) output :
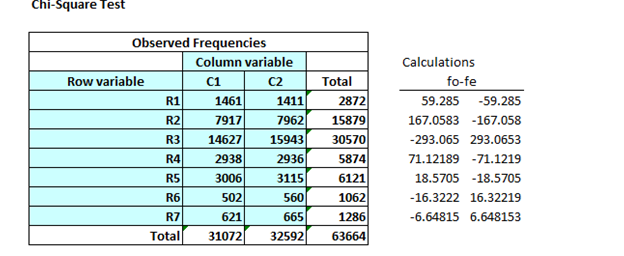
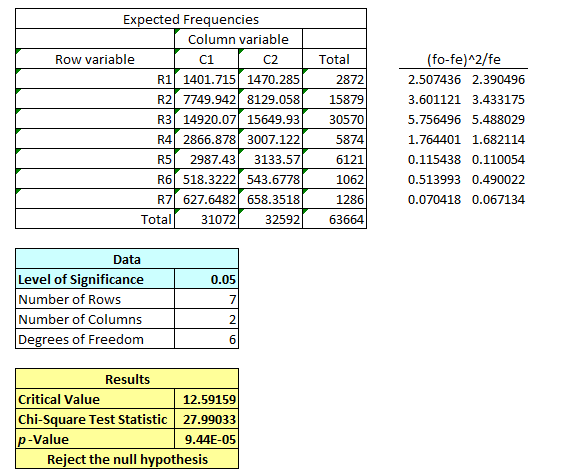
From the EXCEL PHStat the value of the test statistic is 27.990
Thus, the value of the test statistic is 27.990.
Determine the P-value.
From the EXCEL PHStat the P-value is 0.0001
Thus, the P-value is 0.0001.
Conclusion at the 5% level of significance:
Use the significance level as 0.05.
That is, the P-value is less than the level of the significance.

That is, there is no statistical association between sex and poodles for the seven states listed.
Conclusion at the 1% level of significance:
Use the significance level as 0.01.
That is, the P-value is less than the level of the significance.

By rejection rule, reject the null hypothesis.
That is, there is no statistical association between sex and poodles for the seven states listed.

Trending now
This is a popular solution!

Step by step
Solved in 2 steps with 13 images


