The data below is from https://www.worldometers.info/world-population/mexico-population/ Year Population of Mexico 2020 128,932,753 2019 127,575,529 2018 126,190,788 2017 124,777,324 2016 123,333,376 2015 121,858,258 2010 114,092,963 2005 106,005,203 2000 98,899,845 1995 91,663,285 1990 83,943,132 1985 75,983,485 1980 67,761,372 1975 59,607,953 1970 51,493,565 1965 44,123,853 1960 37,771,859 1955 32,350,596 1.. Show how you can verify that your linear model works for this data. (Keep trying until it works, and then come back and prove that it works here.) 2. Use your linear model to predict the population in 2050. Show work, sentence answer. 3. Explain whether you think a linear model is a reasonable approximation. Give specific reasons for your answer.


The data below is from https://www.worldometers.info/world-population/mexico-population/
|
Year |
Population of Mexico |
|
2020 |
128,932,753 |
|
2019 |
127,575,529 |
|
2018 |
126,190,788 |
|
2017 |
124,777,324 |
|
2016 |
123,333,376 |
|
2015 |
121,858,258 |
|
2010 |
114,092,963 |
|
2005 |
106,005,203 |
|
2000 |
98,899,845 |
|
1995 |
91,663,285 |
|
1990 |
83,943,132 |
|
1985 |
75,983,485 |
|
1980 |
67,761,372 |
|
1975 |
59,607,953 |
|
1970 |
51,493,565 |
|
1965 |
44,123,853 |
|
1960 |
37,771,859 |
|
1955 |
32,350,596 |
1.. Show how you can verify that your linear model works for this data. (Keep trying until it works, and then come back and prove that it works here.)
2. Use your linear model to predict the population in 2050. Show work, sentence answer.
3. Explain whether you think a linear model is a reasonable approximation. Give specific reasons for your answer.
1)
Given data of Year and respective population in Mexico as shown below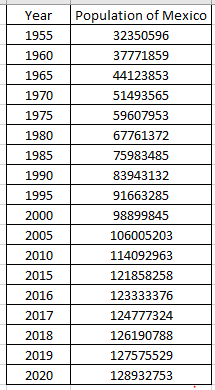
The scatter plot of the data is plotted using excel and Inserted a trend line and the equation of best fit line and its value of Coefficient of determination as shown below.
1. First enter the given data in excel
2. Insert a scatter plot by selecting data and add trend line through Chart elements then display the equation of trend line and R^2 coefficient of determination, we get the following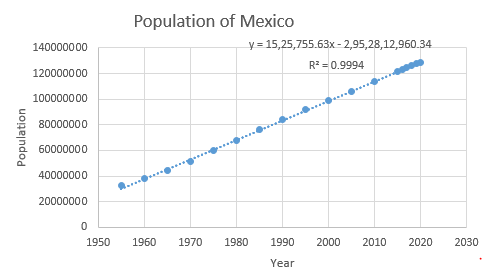
With reference to plot we can clearly see the data form a straight line . Thus we have strong evidence that the relationship is linear and the linear model is
where x is the year and y is the population in Mexico.

Step by step
Solved in 2 steps with 2 images


