The data below is from a random sample of married women drawn from the population of an urban area in a less-developed country. This data has two variables; 'a’ is the age at which each woman was married for the first time, 'b’ is whether or not at least one of their parents had a secondary or higher education (0=no, 1=yes). 1) Estimate the sample mean, variance, standard deviation, and standard error for age at first marriage for the entire population. Calculate the 95% confidence interval around this estimate and interpret. 2) Repeat the analysis from 1) above for each parental education group (*b’) separately. Do the confidence intervals overlap? 3) We hypothesize that children of more educated parents will marry later than children of less well educated parents. Perform a two-sample t-test of this hypothesis, using the folowing formula (the standard error for a two sample t-test combines the standard errors of each group) and interpret your result. Group l'will be those whose parents had more education, group '2' will be those whose parents had less. X1 – X2 t = + n1 n2

MATLAB: An Introduction with Applications
6th Edition
ISBN:9781119256830
Author:Amos Gilat
Publisher:Amos Gilat
Chapter1: Starting With Matlab
Section: Chapter Questions
Problem 1P
icon
Related questions
Topic Video
Question
100%
a
b
9.2
1
13.5
13.5
13.7
14.2
14.5
15.3
15.8
1
17.1
17.5
17.7
17.8
17.9
18.0
18.3
18.8
18.8
19.0
19.9
1
20.2
20.5
1
20.7
21.6
1
22.1
22.7
1
22.7
23.6
24.9
1
26.9
1
27.9
Screenshot
Transcribed Image Text:a b 9.2 1 13.5 13.5 13.7 14.2 14.5 15.3 15.8 1 17.1 17.5 17.7 17.8 17.9 18.0 18.3 18.8 18.8 19.0 19.9 1 20.2 20.5 1 20.7 21.6 1 22.1 22.7 1 22.7 23.6 24.9 1 26.9 1 27.9 Screenshot
The data below is from a random sample of married women drawn from the population of an
urban area in a less-developed country. This data has two variables; 'a' is the age at which each
woman was married for the first time, 'b’ is whether or not at least one of their parents had a
secondary or higher education (0=no, 1=yes).
1) Estimate the sample mean, variance, standard deviation, and standard error for age at first
marriage for the entire population. Calculate the 95% confidence interval around this
estimate and interpret.
2) Repeat the analysis from 1) above for each parental education group (*b’) separately. Do
the confidence intervals overlap?
3) We hypothesize that children of more educated parents will marry later than children of
less well educated parents. Perform a two-sample t-test of this hypothesis, using the
folowing formula (the standard error for a two sample t-test combines the standard errors
of each group) and interpret your result. Group l' will be those whose parents had more
education, group '2' will be those whose parents had less.
X – x2
-
+
n1
n2
Transcribed Image Text:The data below is from a random sample of married women drawn from the population of an urban area in a less-developed country. This data has two variables; 'a' is the age at which each woman was married for the first time, 'b’ is whether or not at least one of their parents had a secondary or higher education (0=no, 1=yes). 1) Estimate the sample mean, variance, standard deviation, and standard error for age at first marriage for the entire population. Calculate the 95% confidence interval around this estimate and interpret. 2) Repeat the analysis from 1) above for each parental education group (*b’) separately. Do the confidence intervals overlap? 3) We hypothesize that children of more educated parents will marry later than children of less well educated parents. Perform a two-sample t-test of this hypothesis, using the folowing formula (the standard error for a two sample t-test combines the standard errors of each group) and interpret your result. Group l' will be those whose parents had more education, group '2' will be those whose parents had less. X – x2 - + n1 n2
Expert Solution
Step 1

We have,

n = 30

n1 =  n2 = 15

We compute the mean, variance, standard deviation and standard error for age at first marriage for the entire population.

We first compute the mean variance and standard deviation using excel formula as below:
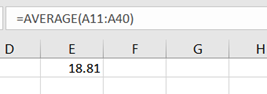
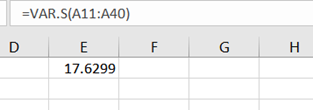
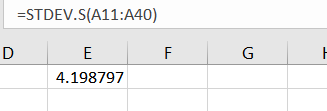
Statistics homework question answer, step 1, image 1

Statistics homework question answer, step 1, image 2

Statistics homework question answer, step 1, image 3

Thus, we have,

Mean = 18.81

Variance = 17.6299

Standard deviation = 4.198797.

Standard error = Standard deviation/√n = 4.198797/√30 = 0.766592.

The 95% confidence interval for population mean for age at first marriage for the entire population is computed as,

CI=x¯ ±tα/2,n-1sn   =18.8±2.04524.19879730           (from t-table)   =18.8±1.567857

Thus, the 95% confidence interval for population mean for age at first marriage for the entire population is (17.23214, 20.36786)

The 95% confidence interval for population mean indicates that there is 95% chance that the true population will be contained in this interval.


trending now

Trending now

This is a popular solution!

steps

Step by step

Solved in 6 steps with 9 images

Blurred answer
Knowledge Booster
Hypothesis Tests and Confidence Intervals for Means
Learn more about
Need a deep-dive on the concept behind this application? Look no further. Learn more about this topic, statistics and related others by exploring similar questions and additional content below.
Similar questions
Recommended textbooks for you
MATLAB: An Introduction with Applications
Statistics
ISBN:
9781119256830
Author:
Amos Gilat
Publisher:
John Wiley & Sons Inc
Probability and Statistics for Engineering and th…
Statistics
ISBN:
9781305251809
Author:
Jay L. Devore
Publisher:
Cengage Learning
Statistics for The Behavioral Sciences (MindTap C…
Statistics
ISBN:
9781305504912
Author:
Frederick J Gravetter, Larry B. Wallnau
Publisher:
Cengage Learning
Elementary Statistics: Picturing the World (7th E…
Statistics
ISBN:
9780134683416
Author:
Ron Larson, Betsy Farber
Publisher:
PEARSON
The Basic Practice of Statistics
Statistics
ISBN:
9781319042578
Author:
David S. Moore, William I. Notz, Michael A. Fligner
Publisher:
W. H. Freeman
Introduction to the Practice of Statistics
Statistics
ISBN:
9781319013387
Author:
David S. Moore, George P. McCabe, Bruce A. Craig
Publisher:
W. H. Freeman