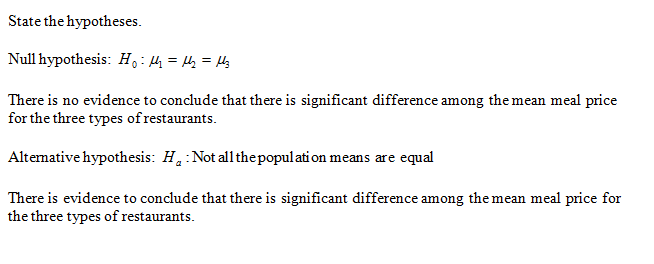
The Consumer Reports Restaurant Customer Satisfaction Survey is based upon 146,099 visits to full-service restaurant chains (Consumer Reports website). One of the variables in the tudy is meal price, the average amount paid per person for dinner and drinks, minus the tip. Suppose a reporter for the Sun Coast Times thought that it would be of interest to her readers to conduct a similar study for restaurants located on the Grand Strand section in Myrtle Beach, South Carolina. The reporter selected a sample of 8 seafood restaurants, 8 Italian restaurants, and 8 steakhouses. The following data show the meal prices ($) obtained for the 24 restaurants sampled. Use a = 0.05 to test whether there is a significant difference among the mean meal price for the three types of restaurants. Treatments Error Total Italian The p-value is - Select your answer - + What is your conclusion? - Select your answer - $ 10 $ 14 $ 17 $ 15 $ 17 $ 22 $ 15 $ 26 Source Sum of Squares Degrees Mean Square F P-value of Variation (to whole number) of Freedom (to 2 decimals) (to 2 decimals) (to 4 decimals) Seafood $ 17 $18 $ 18 $ 24 $ 21 $17 $ 19 $ 18 Steakhouse $ 22 $ 21 $ 25 $26 $21 $ 20 $ 25 $ 31
The Consumer Reports Restaurant Customer Satisfaction Survey is based upon 146,099 visits to full-service restaurant chains (Consumer Reports website). One of the variables in the tudy is meal price, the average amount paid per person for dinner and drinks, minus the tip. Suppose a reporter for the Sun Coast Times thought that it would be of interest to her readers to conduct a similar study for restaurants located on the Grand Strand section in Myrtle Beach, South Carolina. The reporter selected a sample of 8 seafood restaurants, 8 Italian restaurants, and 8 steakhouses. The following data show the meal prices ($) obtained for the 24 restaurants sampled. Use a = 0.05 to test whether there is a significant difference among the mean meal price for the three types of restaurants. Treatments Error Total Italian The p-value is - Select your answer - + What is your conclusion? - Select your answer - $ 10 $ 14 $ 17 $ 15 $ 17 $ 22 $ 15 $ 26 Source Sum of Squares Degrees Mean Square F P-value of Variation (to whole number) of Freedom (to 2 decimals) (to 2 decimals) (to 4 decimals) Seafood $ 17 $18 $ 18 $ 24 $ 21 $17 $ 19 $ 18 Steakhouse $ 22 $ 21 $ 25 $26 $21 $ 20 $ 25 $ 31

MATLAB: An Introduction with Applications
6th Edition
ISBN:9781119256830
Author:Amos Gilat
Publisher:Amos Gilat
Chapter1: Starting With Matlab
Section: Chapter Questions
Problem 1P

Related questions
Question

Transcribed Image Text:The *Consumer Reports* Restaurant Customer Satisfaction Survey is based upon 148,599 visits to full-service restaurant chains (*Consumer Reports* website). One of the variables in the study is meal price, the average amount paid per person for dinner and drinks, minus the tip. Suppose a reporter for the *Sun Coast Times* thought that it would be of interest to her readers to conduct a similar study for restaurants located on the Grand Strand section in Myrtle Beach, South Carolina. The reporter selected a sample of 8 seafood restaurants, 8 Italian restaurants, and 8 steakhouses. The following data show the meal prices ($) obtained for the 24 restaurants sampled. Use \(\alpha = 0.05\) to test whether there is a significant difference among the mean meal price for the three types of restaurants.
| | Italian | Seafood | Steakhouse |
|---------|---------|---------|------------|
| | $10 | $17 | $22 |
| | $14 | $18 | $21 |
| | $17 | $18 | $25 |
| | $15 | $24 | $26 |
| | $17 | $21 | $21 |
| | $22 | $17 | $20 |
| | $15 | $19 | $25 |
| | $26 | $18 | $31 |
Below the table, there is a framework for filling out an ANOVA table to analyze the data:
- Source of Variation
- Sum of Squares (to whole number)
- Degrees of Freedom
- Mean Square (to 2 decimals)
- \( F \) (to 2 decimals)
- \( p \)-value (to 4 decimals)
The table is divided into three parts:
1. Treatments
2. Error
3. Total
The analysis requires filling out the values for these sections to determine if there is any significant difference in meal prices based on restaurant type.
Paragraph prompts at the bottom ask for the \( p \)-value and the conclusion about whether a significant difference in prices exists.
(Note: All computational cells are placeholders to be filled out after analysis.)
Expert Solution
Step 1

Step by step
Solved in 3 steps with 3 images

Recommended textbooks for you
MATLAB: An Introduction with Applications
Statistics
ISBN:
9781119256830
Author:
Amos Gilat
Publisher:
John Wiley & Sons Inc

Probability and Statistics for Engineering and th…
Statistics
ISBN:
9781305251809
Author:
Jay L. Devore
Publisher:
Cengage Learning

Statistics for The Behavioral Sciences (MindTap C…
Statistics
ISBN:
9781305504912
Author:
Frederick J Gravetter, Larry B. Wallnau
Publisher:
Cengage Learning
MATLAB: An Introduction with Applications
Statistics
ISBN:
9781119256830
Author:
Amos Gilat
Publisher:
John Wiley & Sons Inc
Probability and Statistics for Engineering and th…
Statistics
ISBN:
9781305251809
Author:
Jay L. Devore
Publisher:
Cengage Learning
Statistics for The Behavioral Sciences (MindTap C…
Statistics
ISBN:
9781305504912
Author:
Frederick J Gravetter, Larry B. Wallnau
Publisher:
Cengage Learning

Elementary Statistics: Picturing the World (7th E…
Statistics
ISBN:
9780134683416
Author:
Ron Larson, Betsy Farber
Publisher:
PEARSON

The Basic Practice of Statistics
Statistics
ISBN:
9781319042578
Author:
David S. Moore, William I. Notz, Michael A. Fligner
Publisher:
W. H. Freeman

Introduction to the Practice of Statistics
Statistics
ISBN:
9781319013387
Author:
David S. Moore, George P. McCabe, Bruce A. Craig
Publisher:
W. H. Freeman