6.92 334.5 6.17 1049.9 4.88 485.1 4.49 289.6 3.98 551.8 3.74 288.9 3.25 295.2 3.15 500.1 2.76 611.0 2.64 1311.5 2.59 413.8 2.25 263.2 2.23 490.7 0.99 204.2 0.84 491.7 0.64 74.2 0.52 240.6 0.30 56.6 Compute the least-squares line for predicting y from x. Make a plot of residuals versus fitted values. a. b. Compute the least-squares line for predicting y from In x. Make a plot of residuals versus fitted values. Compute the least-squares line for predicting In y from In x. Make a plot of residuals versus fitted values. C. d. Which of the three models (a) through (c) fits best? Explain. Using the best model, predict the peak flow when the discharge is 50.0 km?lyr. e. f. Using the best model, find a 95% prediction interval for the peak flow when the discharge is 50.0 kmlyr. The article "Characteristics and Trends of River Discharge into Hudson, James, and Ungava Bays, 1964-2000" (S. Dery, M. Stieglitz, et al., Journal of Climate, 2005:2540-2557) presents measurements of discharge rate x (in kmlyr) andpeakflow y (in m/s) for 42 rivers that drain into the Hudson, James, and Ungava Bays. The data are shown in the following table: Discharge Peak Flow 94.24 4110.3 66.57 4961.7 59.79 10275.5 48.52 6616.9 40.00 7459.5 32.30 2784.4 31.20 3266.7 30.69 4368.7 26.65 1328.5 22.75 4437.6 21.20 1983.0 20.57 1320.1 19.77 1735.7 18.62 1944.1 17.96 3420.2 17.84 2655.3 16.06 3470.3 1561.6 14.69 11.63 869.8 11.19 936.8 11.08 1315.7 10.92 1727.1 9.94 768.1 7.86 483.3
6.92 334.5 6.17 1049.9 4.88 485.1 4.49 289.6 3.98 551.8 3.74 288.9 3.25 295.2 3.15 500.1 2.76 611.0 2.64 1311.5 2.59 413.8 2.25 263.2 2.23 490.7 0.99 204.2 0.84 491.7 0.64 74.2 0.52 240.6 0.30 56.6 Compute the least-squares line for predicting y from x. Make a plot of residuals versus fitted values. a. b. Compute the least-squares line for predicting y from In x. Make a plot of residuals versus fitted values. Compute the least-squares line for predicting In y from In x. Make a plot of residuals versus fitted values. C. d. Which of the three models (a) through (c) fits best? Explain. Using the best model, predict the peak flow when the discharge is 50.0 km?lyr. e. f. Using the best model, find a 95% prediction interval for the peak flow when the discharge is 50.0 kmlyr. The article "Characteristics and Trends of River Discharge into Hudson, James, and Ungava Bays, 1964-2000" (S. Dery, M. Stieglitz, et al., Journal of Climate, 2005:2540-2557) presents measurements of discharge rate x (in kmlyr) andpeakflow y (in m/s) for 42 rivers that drain into the Hudson, James, and Ungava Bays. The data are shown in the following table: Discharge Peak Flow 94.24 4110.3 66.57 4961.7 59.79 10275.5 48.52 6616.9 40.00 7459.5 32.30 2784.4 31.20 3266.7 30.69 4368.7 26.65 1328.5 22.75 4437.6 21.20 1983.0 20.57 1320.1 19.77 1735.7 18.62 1944.1 17.96 3420.2 17.84 2655.3 16.06 3470.3 1561.6 14.69 11.63 869.8 11.19 936.8 11.08 1315.7 10.92 1727.1 9.94 768.1 7.86 483.3

MATLAB: An Introduction with Applications
6th Edition
ISBN:9781119256830
Author:Amos Gilat
Publisher:Amos Gilat
Chapter1: Starting With Matlab
Section: Chapter Questions
Problem 1P

Related questions
Question

Transcribed Image Text:6.92
334.5
6.17
1049.9
4.88
485.1
4.49
289.6
3.98
551.8
3.74
288.9
3.25
295.2
3.15
500.1
2.76
611.0
2.64
1311.5
2.59
413.8
2.25
263.2
2.23
490.7
0.99
204.2
0.84
491.7
0.64
74.2
0.52
240.6
0.30
56.6
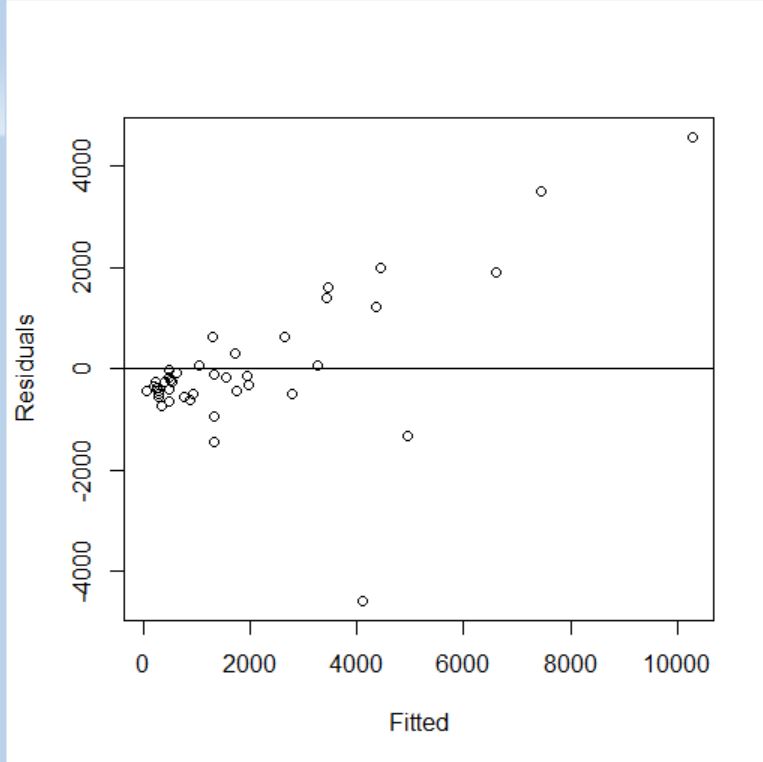
Compute the least-squares line for predicting y from x. Make a plot of residuals versus
fitted values.
a.
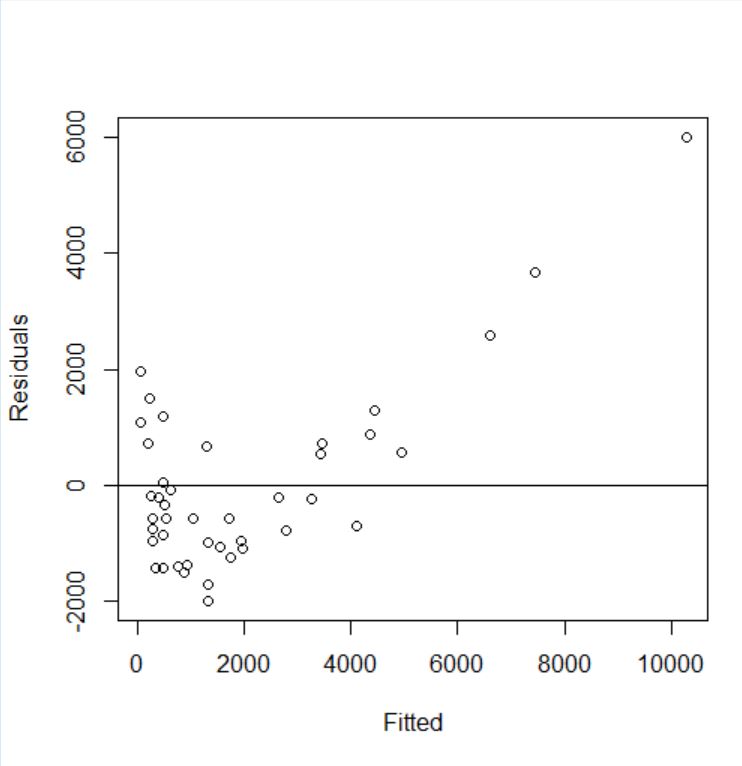
b. Compute the least-squares line for predicting y from In x. Make a plot of residuals
versus fitted values.
Compute the least-squares line for predicting In y from In x. Make a plot of residuals
versus fitted values.
C.
d.
Which of the three models (a) through (c) fits best? Explain.
Using the best model, predict the peak flow when the discharge is 50.0 km?lyr.
e.
f.
Using the best model, find a 95% prediction interval for the peak flow when the
discharge is 50.0 kmlyr.

Transcribed Image Text:The article "Characteristics and Trends of River Discharge into Hudson, James, and Ungava
Bays, 1964-2000" (S. Dery, M. Stieglitz, et al., Journal of Climate, 2005:2540-2557)
presents measurements of discharge rate x (in kmlyr) andpeakflow y (in m/s) for 42 rivers
that drain into the Hudson, James, and Ungava Bays. The data are shown in the following
table:
Discharge
Peak Flow
94.24
4110.3
66.57
4961.7
59.79
10275.5
48.52
6616.9
40.00
7459.5
32.30
2784.4
31.20
3266.7
30.69
4368.7
26.65
1328.5
22.75
4437.6
21.20
1983.0
20.57
1320.1
19.77
1735.7
18.62
1944.1
17.96
3420.2
17.84
2655.3
16.06
3470.3
1561.6
14.69
11.63
869.8
11.19
936.8
11.08
1315.7
10.92
1727.1
9.94
768.1
7.86
483.3
Expert Solution
Step 1
For estimating the regression equation using least squares, we will use R to find for the regression equation:-
The command which is used is lm(y~x).
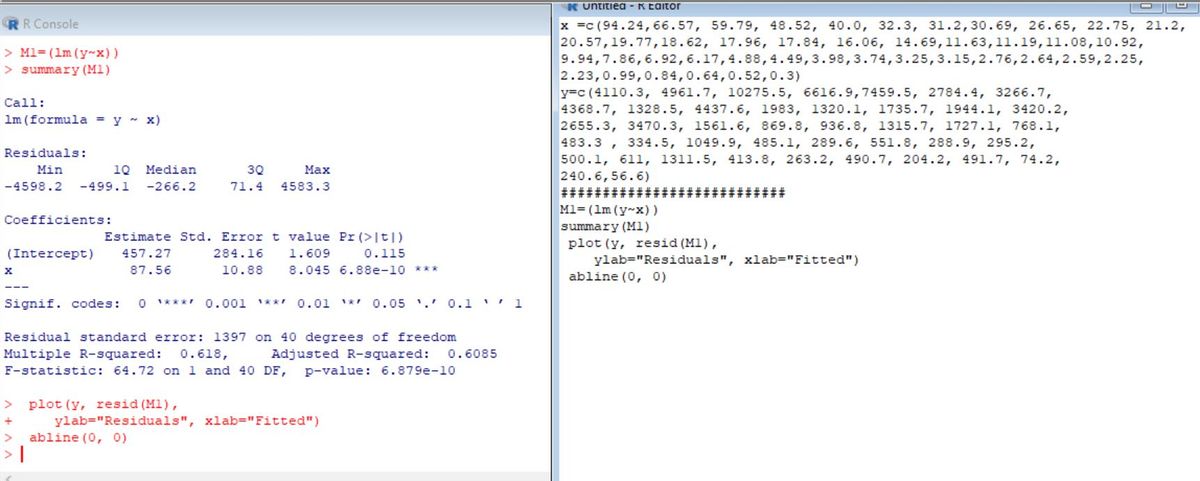
Y = 457.27 + 87.56 X
Step 2
B) It is also solved in R using the same command in (A).
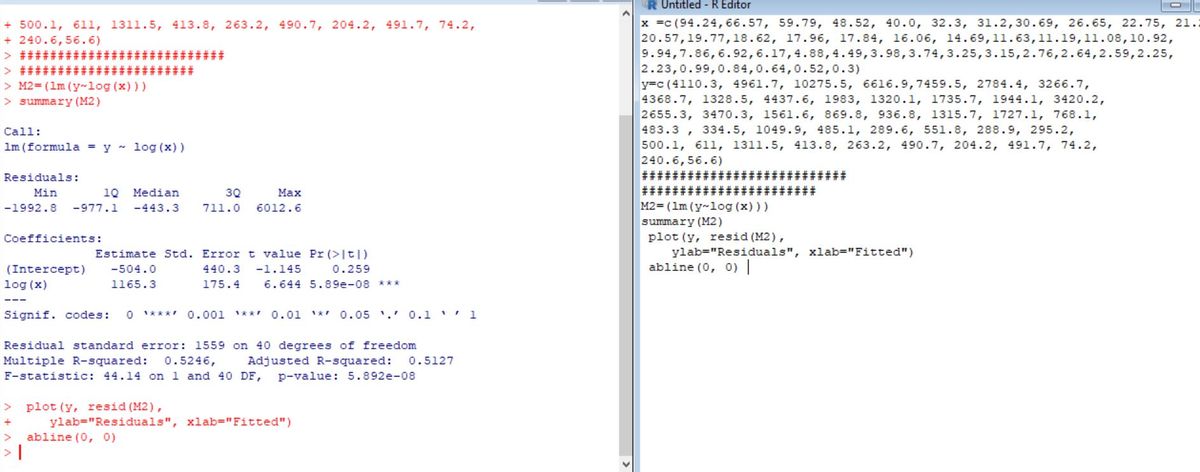
The regression equation will be
Y = 1165.3 log(X) -504

Step by step
Solved in 3 steps with 6 images

Recommended textbooks for you
MATLAB: An Introduction with Applications
Statistics
ISBN:
9781119256830
Author:
Amos Gilat
Publisher:
John Wiley & Sons Inc

Probability and Statistics for Engineering and th…
Statistics
ISBN:
9781305251809
Author:
Jay L. Devore
Publisher:
Cengage Learning

Statistics for The Behavioral Sciences (MindTap C…
Statistics
ISBN:
9781305504912
Author:
Frederick J Gravetter, Larry B. Wallnau
Publisher:
Cengage Learning
MATLAB: An Introduction with Applications
Statistics
ISBN:
9781119256830
Author:
Amos Gilat
Publisher:
John Wiley & Sons Inc
Probability and Statistics for Engineering and th…
Statistics
ISBN:
9781305251809
Author:
Jay L. Devore
Publisher:
Cengage Learning
Statistics for The Behavioral Sciences (MindTap C…
Statistics
ISBN:
9781305504912
Author:
Frederick J Gravetter, Larry B. Wallnau
Publisher:
Cengage Learning

Elementary Statistics: Picturing the World (7th E…
Statistics
ISBN:
9780134683416
Author:
Ron Larson, Betsy Farber
Publisher:
PEARSON

The Basic Practice of Statistics
Statistics
ISBN:
9781319042578
Author:
David S. Moore, William I. Notz, Michael A. Fligner
Publisher:
W. H. Freeman

Introduction to the Practice of Statistics
Statistics
ISBN:
9781319013387
Author:
David S. Moore, George P. McCabe, Bruce A. Craig
Publisher:
W. H. Freeman