Compare California's adjusted rate with that of Florida. Use information in the table provide
Compare California's adjusted rate with that of Florida. Use information in the table provide

MATLAB: An Introduction with Applications
6th Edition
ISBN:9781119256830
Author:Amos Gilat
Publisher:Amos Gilat
Chapter1: Starting With Matlab
Section: Chapter Questions
Problem 1P

Related questions
Question
Compare California's adjusted rate with that of Florida. Use information in the table provided.

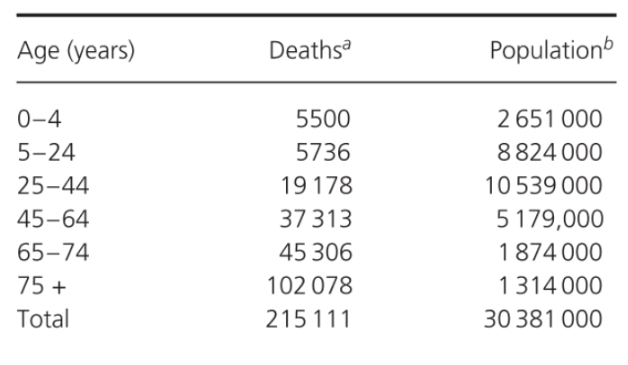
Transcribed Image Text:### Demographic Data on Deaths and Population
This table presents the number of deaths and the population for various age groups. Each age group's data is shown alongside the total figures for deaths and population.
| Age (years) | Deaths | Population |
|-------------|----------|------------|
| 0–4 | 5,500 | 2,651,000 |
| 5–24 | 5,736 | 8,824,000 |
| 25–44 | 19,178 | 10,539,000 |
| 45–64 | 37,313 | 5,179,000 |
| 65–74 | 45,306 | 1,874,000 |
| 75+ | 102,078 | 1,314,000 |
| **Total** | **215,111** | **30,381,000** |
- **Age Groups**: This data is categorized by different age groups, ranging from newborns to individuals 75 years and older.
- **Deaths**: Represents the total number of deaths within each age group.
- **Population**: Indicates the total population within each respective age group.
This demographic data could be used for analyzing health trends, resource allocation, and understanding age-specific mortality rates.

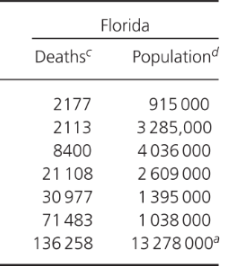
Transcribed Image Text:The table presents mortality data for Alaska and Florida, broken down by age groups, with corresponding population figures.
**Alaska:**
- **Age 0–4**: 122 deaths; Population: 57,000
- **Age 5–24**: 144 deaths; Population: 179,000
- **Age 25–44**: 382 deaths; Population: 222,000
- **Age 45–64**: 563 deaths; Population: 88,000
- **Age 65–74**: 406 deaths; Population: 16,000
- **Age 75+**: 582 deaths; Population: 7,000
- **Total Deaths**: 2,200; Total Population: 569,000
**Florida:**
- **Age 0–4**: 2,177 deaths; Population: 915,000
- **Age 5–24**: 2,113 deaths; Population: 3,285,000
- **Age 25–44**: 8,400 deaths; Population: 4,036,000
- **Age 45–64**: 21,108 deaths; Population: 2,609,000
- **Age 65–74**: 30,977 deaths; Population: 1,395,000
- **Age 75+**: 71,483 deaths; Population: 1,038,000
- **Total Deaths**: 136,258; Total Population: 13,278,000
The table highlights the differences in the number of deaths and population sizes between various age groups in Alaska and Florida.
Expert Solution
Step 1: Given Information:
Consider the provided table to calculate the California adjusted rate and Florida adjusted rate:
Florida:

Step by step
Solved in 3 steps with 6 images

Recommended textbooks for you
MATLAB: An Introduction with Applications
Statistics
ISBN:
9781119256830
Author:
Amos Gilat
Publisher:
John Wiley & Sons Inc

Probability and Statistics for Engineering and th…
Statistics
ISBN:
9781305251809
Author:
Jay L. Devore
Publisher:
Cengage Learning

Statistics for The Behavioral Sciences (MindTap C…
Statistics
ISBN:
9781305504912
Author:
Frederick J Gravetter, Larry B. Wallnau
Publisher:
Cengage Learning
MATLAB: An Introduction with Applications
Statistics
ISBN:
9781119256830
Author:
Amos Gilat
Publisher:
John Wiley & Sons Inc
Probability and Statistics for Engineering and th…
Statistics
ISBN:
9781305251809
Author:
Jay L. Devore
Publisher:
Cengage Learning
Statistics for The Behavioral Sciences (MindTap C…
Statistics
ISBN:
9781305504912
Author:
Frederick J Gravetter, Larry B. Wallnau
Publisher:
Cengage Learning

Elementary Statistics: Picturing the World (7th E…
Statistics
ISBN:
9780134683416
Author:
Ron Larson, Betsy Farber
Publisher:
PEARSON

The Basic Practice of Statistics
Statistics
ISBN:
9781319042578
Author:
David S. Moore, William I. Notz, Michael A. Fligner
Publisher:
W. H. Freeman

Introduction to the Practice of Statistics
Statistics
ISBN:
9781319013387
Author:
David S. Moore, George P. McCabe, Bruce A. Craig
Publisher:
W. H. Freeman