The annual revenue of Amazon is given in the table below (source ). Year 2020 2019 2018 2017 2016 2015 2014 2013 2012 2011 2010 Amazon Annual Revenue (Billions of US dollars) 386.064 280.522 232.887 177.866 135.987 107.006 88.988 74.452 61.093 48.077 34.204 See the Regression page in the Chapter 1: Linear Equations and Graphs module for details creating a regression model. Apply linear regression to the data in the table to find a model y = mx + b, where y is Amazon's annual revenue in billions of US dollars, and a is the number of years 2010.
The annual revenue of Amazon is given in the table below (source ). Year 2020 2019 2018 2017 2016 2015 2014 2013 2012 2011 2010 Amazon Annual Revenue (Billions of US dollars) 386.064 280.522 232.887 177.866 135.987 107.006 88.988 74.452 61.093 48.077 34.204 See the Regression page in the Chapter 1: Linear Equations and Graphs module for details creating a regression model. Apply linear regression to the data in the table to find a model y = mx + b, where y is Amazon's annual revenue in billions of US dollars, and a is the number of years 2010.

MATLAB: An Introduction with Applications
6th Edition
ISBN:9781119256830
Author:Amos Gilat
Publisher:Amos Gilat
Chapter1: Starting With Matlab
Section: Chapter Questions
Problem 1P

Related questions
Question

Transcribed Image Text:Amazon Revenue
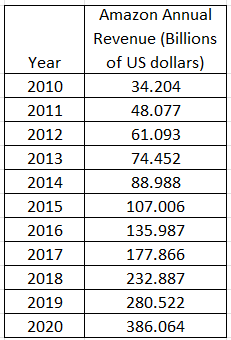
The annual revenue of Amazon is given in the table below (source ).
Year
2020
2019
2018
2017
2016
2015
2014
2013
2012
2011
2010
Amazon Annual
Revenue
(Billions of US dollars)
386.064
280.522
232.887
177.866
135.987
107.006
88.988
74.452
61.093
48.077
34.204
See the Regression page in the Chapter 1: Linear Equations and Graphs module for details on
creating a regression model.
Apply linear regression to the data in the table to find a model
y = mx + b,
where y is Amazon's annual revenue in billions of US dollars, and is the number of years since
2010.

Transcribed Image Text:In what year will the estimated revenue of Amazon be 1,040 billion US dollars? Note: I am asking for
the year, not the number of years since 2010. This may happen between two years. Round to the
nearest year.
Expert Solution
Step 1
Given data:

Trending now
This is a popular solution!

Step by step
Solved in 2 steps with 2 images

Recommended textbooks for you
MATLAB: An Introduction with Applications
Statistics
ISBN:
9781119256830
Author:
Amos Gilat
Publisher:
John Wiley & Sons Inc

Probability and Statistics for Engineering and th…
Statistics
ISBN:
9781305251809
Author:
Jay L. Devore
Publisher:
Cengage Learning

Statistics for The Behavioral Sciences (MindTap C…
Statistics
ISBN:
9781305504912
Author:
Frederick J Gravetter, Larry B. Wallnau
Publisher:
Cengage Learning
MATLAB: An Introduction with Applications
Statistics
ISBN:
9781119256830
Author:
Amos Gilat
Publisher:
John Wiley & Sons Inc
Probability and Statistics for Engineering and th…
Statistics
ISBN:
9781305251809
Author:
Jay L. Devore
Publisher:
Cengage Learning
Statistics for The Behavioral Sciences (MindTap C…
Statistics
ISBN:
9781305504912
Author:
Frederick J Gravetter, Larry B. Wallnau
Publisher:
Cengage Learning

Elementary Statistics: Picturing the World (7th E…
Statistics
ISBN:
9780134683416
Author:
Ron Larson, Betsy Farber
Publisher:
PEARSON

The Basic Practice of Statistics
Statistics
ISBN:
9781319042578
Author:
David S. Moore, William I. Notz, Michael A. Fligner
Publisher:
W. H. Freeman

Introduction to the Practice of Statistics
Statistics
ISBN:
9781319013387
Author:
David S. Moore, George P. McCabe, Bruce A. Craig
Publisher:
W. H. Freeman