The ages (in years) and heights (in inches) of all pitchers for a baseball team are listed. Find the coefficient of variation for each of the two data sets. Then compare the results. :: Click the icon to view the data sets. CV neights % (Round to one decimal place as needed.)


Contingency Table
A contingency table can be defined as the visual representation of the relationship between two or more categorical variables that can be evaluated and registered. It is a categorical version of the scatterplot, which is used to investigate the linear relationship between two variables. A contingency table is indeed a type of frequency distribution table that displays two variables at the same time.
Binomial Distribution
Binomial is an algebraic expression of the sum or the difference of two terms. Before knowing about binomial distribution, we must know about the binomial theorem.

CV calculation for Height (inches)
The sample size is . We need to compute the sample mean and sample variance are shown in the table below:
| Height | Height2 | |
| 78 | 6084 | |
| 78 | 6084 | |
| 74 | 5476 | |
| 78 | 6084 | |
| 75 | 5625 | |
| 78 | 6084 | |
| 77 | 5929 | |
| 75 | 5625 | |
| 79 | 6241 | |
| 78 | 6084 | |
| 74 | 5476 | |
| 78 | 6084 | |
| Sum = | 922 | 70876 |
The sample mean is computed as follows:
Also, the sample variance is
Therefore, the sample standard deviation is
Now,
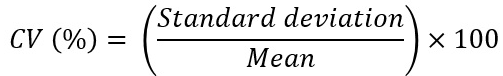
We all know that Coefficient of variation , CV is

Trending now
This is a popular solution!

Step by step
Solved in 2 steps with 2 images


