Test the claim about the difference between two population means u, and u, at the level of significance a. Assume the samples are random and independent, and the populations are normally distributed. Claim: , =2; a = 0.01 Population statistics: o, = 3.3, o2 = 1.5 Sample statistics: X, = 18, n, = 30, x2 = 20, n2 = 29 Determine the alternative hypothesis. H2 Determine the standardized test statistic. (Round to two decimal places as needed.) Determine the P-value. P-value = (Round to three decimal places as needed.) What is the proper decision? the 19/ lo Lof cignifeanee to roinet the olaim
Test the claim about the difference between two population means u, and u, at the level of significance a. Assume the samples are random and independent, and the populations are normally distributed. Claim: , =2; a = 0.01 Population statistics: o, = 3.3, o2 = 1.5 Sample statistics: X, = 18, n, = 30, x2 = 20, n2 = 29 Determine the alternative hypothesis. H2 Determine the standardized test statistic. (Round to two decimal places as needed.) Determine the P-value. P-value = (Round to three decimal places as needed.) What is the proper decision? the 19/ lo Lof cignifeanee to roinet the olaim

MATLAB: An Introduction with Applications
6th Edition
ISBN:9781119256830
Author:Amos Gilat
Publisher:Amos Gilat
Chapter1: Starting With Matlab
Section: Chapter Questions
Problem 1P

Related questions
Question

Transcribed Image Text:Question HHelp
Test the claim about the difference between two population means u, and H, at the level of significance a., Assume the samples are random and independent, and the populations are normally distributed.
Claim: u, =µ2; a = 0.01
Population statistics: o, = 3.3, o2 = 1.5
Sample statistics: x, = 18, n, = 30, X2 = 20, n2 = 29
Determine the alternative hypothesis.
Ha: H1
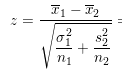
Determine the standardized test statistic.
(Round to two decimal places as needed.)
z=
Determine the P-value.
P-value = (Round to three decimal places as needed.)
What is the proper decision?
OA Enil tn rminnt U
Thore in onouah idene at the 10. louel of eianifinannn to reinnt the alaim
(?

Transcribed Image Text:Question Help ▼
Test the claim about the difference between two population means u, and u, at the level of significance a. Assume the samples are random and independent, and the populations are normally distributed.
Claim: µ, = µ2; a = 0.01
Population statistics: 0, =3.3, o2 = 1.5
Sample statistics: x, = 18, n, = 30, x2 = 20, n2 = 29
Determine the P-value.
P-value = (Round to three decimal places as needed.)
What is the proper decision?
O A. Fail to reject H. There is enough evidence at the 1% level of significance to reject the claim.
O B. Reject Ho. There is not enough evidence at the 1% level of significance to reject the claim.
O C. Fail to reject Ho. There is not enough evidence at the 1% level of significance to reject the claim.
O D. Reject H. There is enough evidence at the 1% level of significance to reject the claim.
Click to select vour answer(s).
Expert Solution
Given:
Hypothesis testing:
Test statistic:

Step by step
Solved in 5 steps with 1 images

Knowledge Booster


Learn more about
Need a deep-dive on the concept behind this application? Look no further. Learn more about this topic, statistics and related others by exploring similar questions and additional content below.Recommended textbooks for you
MATLAB: An Introduction with Applications
Statistics
ISBN:
9781119256830
Author:
Amos Gilat
Publisher:
John Wiley & Sons Inc

Probability and Statistics for Engineering and th…
Statistics
ISBN:
9781305251809
Author:
Jay L. Devore
Publisher:
Cengage Learning

Statistics for The Behavioral Sciences (MindTap C…
Statistics
ISBN:
9781305504912
Author:
Frederick J Gravetter, Larry B. Wallnau
Publisher:
Cengage Learning
MATLAB: An Introduction with Applications
Statistics
ISBN:
9781119256830
Author:
Amos Gilat
Publisher:
John Wiley & Sons Inc
Probability and Statistics for Engineering and th…
Statistics
ISBN:
9781305251809
Author:
Jay L. Devore
Publisher:
Cengage Learning
Statistics for The Behavioral Sciences (MindTap C…
Statistics
ISBN:
9781305504912
Author:
Frederick J Gravetter, Larry B. Wallnau
Publisher:
Cengage Learning

Elementary Statistics: Picturing the World (7th E…
Statistics
ISBN:
9780134683416
Author:
Ron Larson, Betsy Farber
Publisher:
PEARSON

The Basic Practice of Statistics
Statistics
ISBN:
9781319042578
Author:
David S. Moore, William I. Notz, Michael A. Fligner
Publisher:
W. H. Freeman

Introduction to the Practice of Statistics
Statistics
ISBN:
9781319013387
Author:
David S. Moore, George P. McCabe, Bruce A. Craig
Publisher:
W. H. Freeman