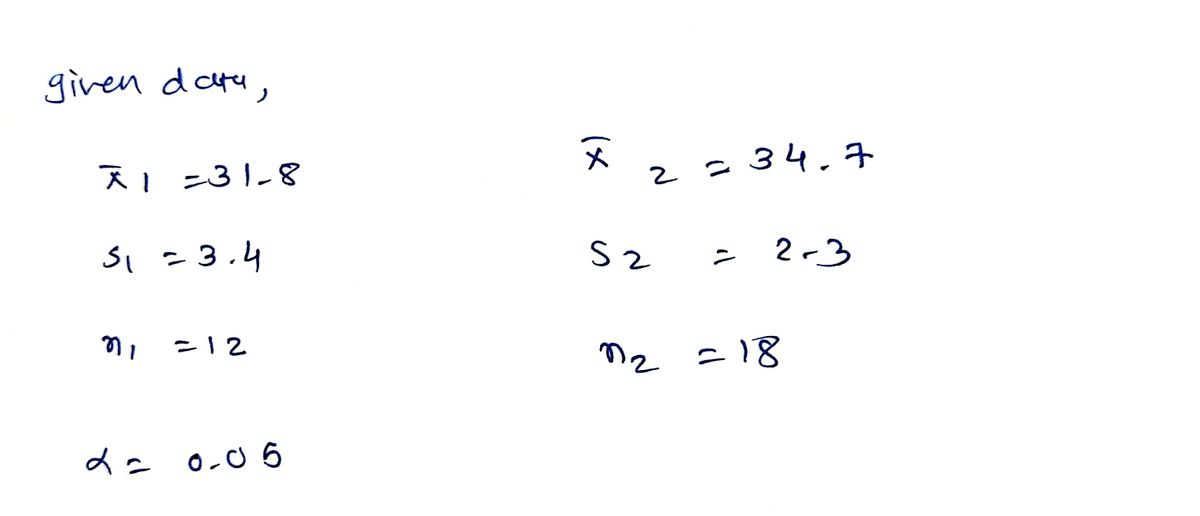
Test the claim about the difference between two population means µ, and µ2 at the level of significance a. Assume the samples are random and independent, and the populations are normally distributed. Claim: H1 = 42; a = 0.05. Assume o? =o Sample statistics: x, = 31.8, s, = 3.4, n, = 12 and X2 = 34.7, s2 = 2.3, n2 = 18 ..... Identify the null and alternative hypotheses. Choose the correct answer below. O A. Ho: H12 H2 B. Họ: H1 H2 O E. Ho: H1 SH2 Ha: H1 > H2 Ha: H1 SH2 Find the standardized test statistic t. (Round to two decimal places as needed.) Find the P-value. P= (Round to three decimal places as needed.) Decide whether to reject or fail to reject the null hypothesis and interpret the decision in the context of the original claim. Ho. There enough evidence at the 5% level of significance to reject the claim.
Test the claim about the difference between two population means µ, and µ2 at the level of significance a. Assume the samples are random and independent, and the populations are normally distributed. Claim: H1 = 42; a = 0.05. Assume o? =o Sample statistics: x, = 31.8, s, = 3.4, n, = 12 and X2 = 34.7, s2 = 2.3, n2 = 18 ..... Identify the null and alternative hypotheses. Choose the correct answer below. O A. Ho: H12 H2 B. Họ: H1 H2 O E. Ho: H1 SH2 Ha: H1 > H2 Ha: H1 SH2 Find the standardized test statistic t. (Round to two decimal places as needed.) Find the P-value. P= (Round to three decimal places as needed.) Decide whether to reject or fail to reject the null hypothesis and interpret the decision in the context of the original claim. Ho. There enough evidence at the 5% level of significance to reject the claim.

MATLAB: An Introduction with Applications
6th Edition
ISBN:9781119256830
Author:Amos Gilat
Publisher:Amos Gilat
Chapter1: Starting With Matlab
Section: Chapter Questions
Problem 1P

Related questions
Question

Transcribed Image Text:**Testing the Claim About the Difference Between Two Population Means**
**Objective:** Test the claim about the difference between two population means \( \mu_1 \) and \( \mu_2 \) at the significance level \( \alpha \). Assume the samples are random and independent, and the populations are normally distributed.
**Claim:** \( \mu_1 = \mu_2 \); \( \alpha = 0.05 \). Assume \( \sigma_1^2 = \sigma_2^2 \).
**Sample Statistics:**
- \( \bar{x}_1 = 31.8 \), \( s_1 = 3.4 \), \( n_1 = 12 \)
- \( \bar{x}_2 = 34.7 \), \( s_2 = 2.3 \), \( n_2 = 18 \)
---
**Steps:**
1. **Identify the Null and Alternative Hypotheses**:
- Choose the correct answer from the options provided:
- A. \( H_0: \mu_1 \geq \mu_2 \); \( H_a: \mu_1 < \mu_2 \)
- B. \( H_0: \mu_1 < \mu_2 \); \( H_a: \mu_1 \geq \mu_2 \)
- C. \( H_0: \mu_1 \neq \mu_2 \); \( H_a: \mu_1 = \mu_2 \)
- D. \( H_0: \mu_1 = \mu_2 \); \( H_a: \mu_1 \neq \mu_2 \)
- E. \( H_0: \mu_1 \leq \mu_2 \); \( H_a: \mu_1 > \mu_2 \)
- F. \( H_0: \mu_1 > \mu_2 \); \( H_a: \mu_1 \leq \mu_2 \)
2. **Find the Standardized Test Statistic \( t \)**:
- \( t = \) (Round to two decimal places as needed.)
3. **Find the P-value**:
- \( P = \) (Round to three decimal places as needed.)
4. **Decision Making**:
- Decide whether to reject or fail to reject
Expert Solution
Step 1

Step by step
Solved in 2 steps with 2 images

Recommended textbooks for you
MATLAB: An Introduction with Applications
Statistics
ISBN:
9781119256830
Author:
Amos Gilat
Publisher:
John Wiley & Sons Inc

Probability and Statistics for Engineering and th…
Statistics
ISBN:
9781305251809
Author:
Jay L. Devore
Publisher:
Cengage Learning

Statistics for The Behavioral Sciences (MindTap C…
Statistics
ISBN:
9781305504912
Author:
Frederick J Gravetter, Larry B. Wallnau
Publisher:
Cengage Learning
MATLAB: An Introduction with Applications
Statistics
ISBN:
9781119256830
Author:
Amos Gilat
Publisher:
John Wiley & Sons Inc
Probability and Statistics for Engineering and th…
Statistics
ISBN:
9781305251809
Author:
Jay L. Devore
Publisher:
Cengage Learning
Statistics for The Behavioral Sciences (MindTap C…
Statistics
ISBN:
9781305504912
Author:
Frederick J Gravetter, Larry B. Wallnau
Publisher:
Cengage Learning

Elementary Statistics: Picturing the World (7th E…
Statistics
ISBN:
9780134683416
Author:
Ron Larson, Betsy Farber
Publisher:
PEARSON

The Basic Practice of Statistics
Statistics
ISBN:
9781319042578
Author:
David S. Moore, William I. Notz, Michael A. Fligner
Publisher:
W. H. Freeman

Introduction to the Practice of Statistics
Statistics
ISBN:
9781319013387
Author:
David S. Moore, George P. McCabe, Bruce A. Craig
Publisher:
W. H. Freeman