Terms: amplitude (A), phase angle (p), frequency (f), angular frequency (w), period (T), peak value (Vp), peak-to-peak value (Vpp). Draw a 60 Hz, 5 Vp sine wave on a coordinate axis and graphically identify as many of the terms as possible from the previous section. Use voltage in volts for the y-axis, and time in milliseconds for the x-axis. You can use the blank OSC templates shown in the procedure section to draw the signals.
Terms: amplitude (A), phase angle (p), frequency (f), angular frequency (w), period (T), peak value (Vp), peak-to-peak value (Vpp). Draw a 60 Hz, 5 Vp sine wave on a coordinate axis and graphically identify as many of the terms as possible from the previous section. Use voltage in volts for the y-axis, and time in milliseconds for the x-axis. You can use the blank OSC templates shown in the procedure section to draw the signals.

Introductory Circuit Analysis (13th Edition)
13th Edition
ISBN:9780133923605
Author:Robert L. Boylestad
Publisher:Robert L. Boylestad
Chapter1: Introduction
Section: Chapter Questions
Problem 1P: Visit your local library (at school or home) and describe the extent to which it provides literature...

Related questions

Question
Explain how to convert the X-axis time values (in milliseconds) so that you can redraw the graph using degrees on the horizontal axis. Make the drawing and rotate the important angles.
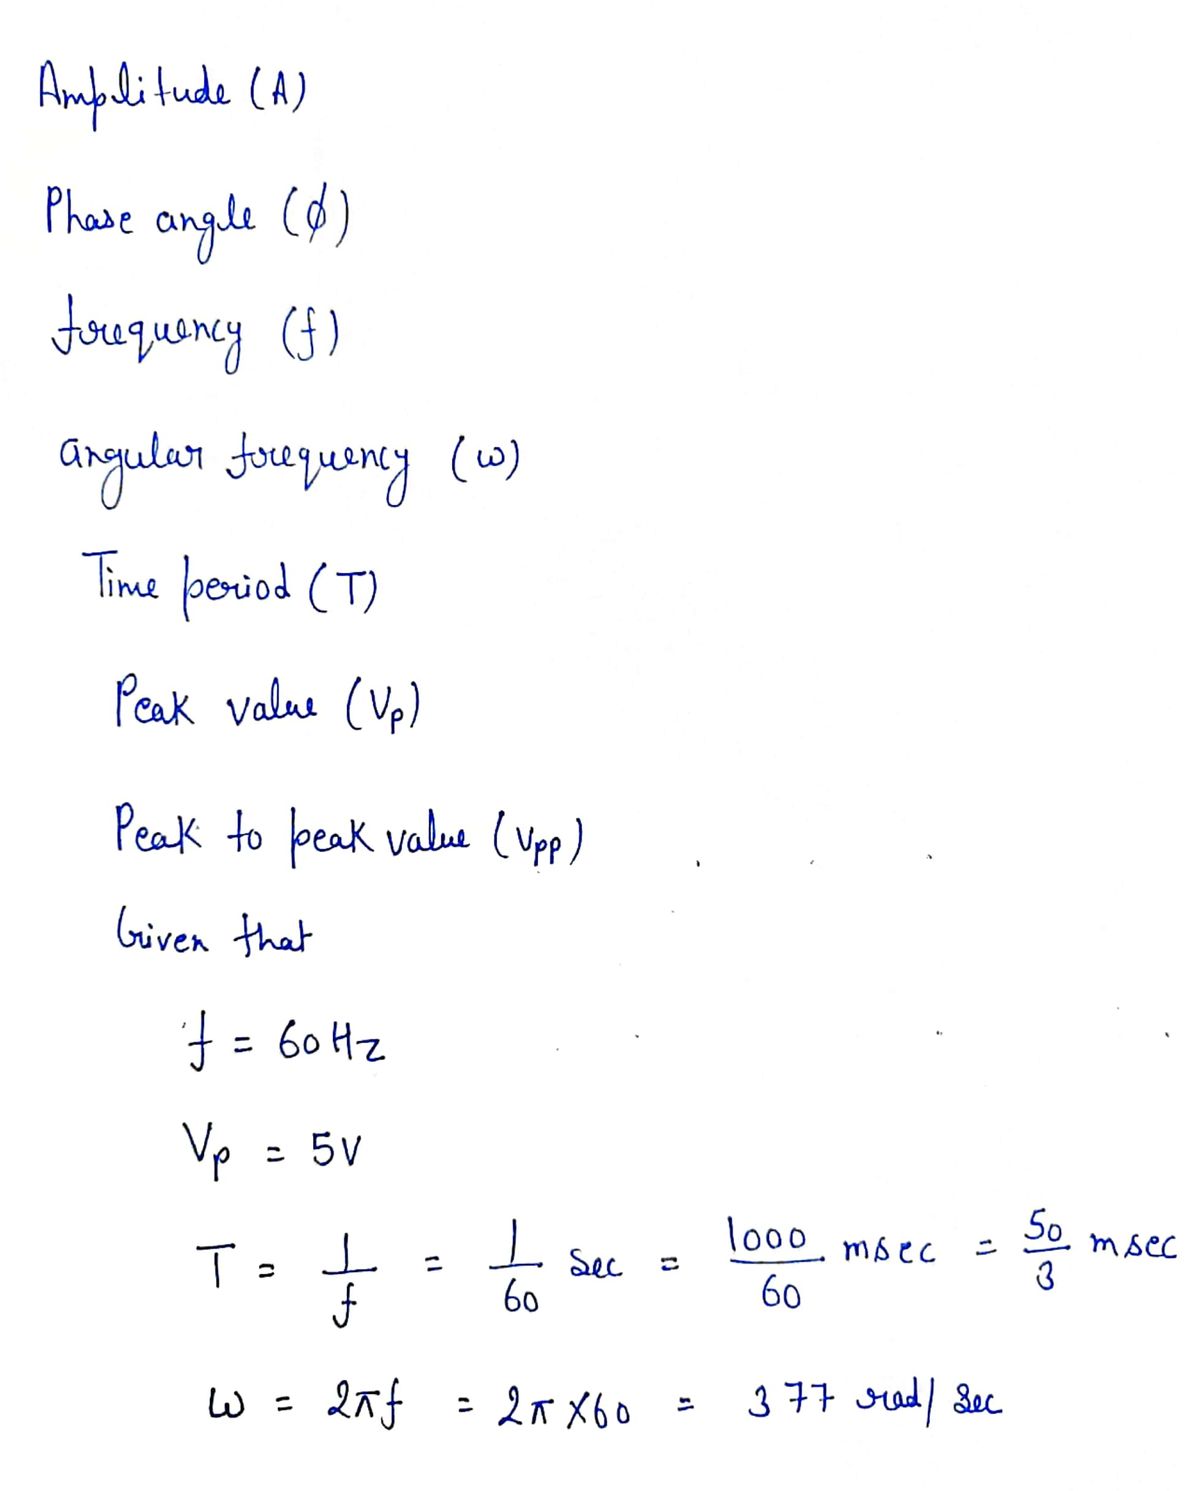
![Terms: amplitude (A), phase angle (p), frequency (f), angular frequency (w),
period (T), peak value (Vp), peak-to-peak value (Vpp).
Draw a 60 Hz, 5 Vp sine wave on a coordinate axis and graphically identify as
many of the terms as possible from the previous section. Use voltage in volts
for the y-axis, and time in milliseconds for the x-axis. You can use the blank
OSC templates shown in the procedure section to draw the signals.
Expert Solution
Vp 5 Volls
f = 60H₂
Time period (T) = '/f
angular frequency (W) = 2πTf
=2 TT (60)
= ㅗ seconds
60
Amplitude (A) = 5 volts,
Vp = 5
=
vp
milli seconds
below plot)
peak to Peak Value
(UPP) = 2 Vp=2 (5) = 10, volts
Phase
we can't find. E didn't mention
about horizontal axis shifting]
T
377 rad/see.
Upp
PA
TA
25/3
50%
5 volts, (from
25
100
t
(ms)](/v2/_next/image?url=https%3A%2F%2Fcontent.bartleby.com%2Fqna-images%2Fquestion%2F21ff491d-d77d-4861-94b9-2bc36c90c2c9%2F8fdd9710-e987-4af4-aa1b-bdc3baa84d1b%2Frz3gko_processed.jpeg&w=3840&q=75)
Transcribed Image Text:Terms: amplitude (A), phase angle (p), frequency (f), angular frequency (w),
period (T), peak value (Vp), peak-to-peak value (Vpp).
Draw a 60 Hz, 5 Vp sine wave on a coordinate axis and graphically identify as
many of the terms as possible from the previous section. Use voltage in volts
for the y-axis, and time in milliseconds for the x-axis. You can use the blank
OSC templates shown in the procedure section to draw the signals.
Expert Solution
Vp 5 Volls
f = 60H₂
Time period (T) = '/f
angular frequency (W) = 2πTf
=2 TT (60)
= ㅗ seconds
60
Amplitude (A) = 5 volts,
Vp = 5
=
vp
milli seconds
below plot)
peak to Peak Value
(UPP) = 2 Vp=2 (5) = 10, volts
Phase
we can't find. E didn't mention
about horizontal axis shifting]
T
377 rad/see.
Upp
PA
TA
25/3
50%
5 volts, (from
25
100
t
(ms)
Expert Solution
Step 1

Step by step
Solved in 3 steps with 3 images

Knowledge Booster


Learn more about
Need a deep-dive on the concept behind this application? Look no further. Learn more about this topic, electrical-engineering and related others by exploring similar questions and additional content below.Recommended textbooks for you
Introductory Circuit Analysis (13th Edition)
Electrical Engineering
ISBN:
9780133923605
Author:
Robert L. Boylestad
Publisher:
PEARSON

Delmar's Standard Textbook Of Electricity
Electrical Engineering
ISBN:
9781337900348
Author:
Stephen L. Herman
Publisher:
Cengage Learning

Programmable Logic Controllers
Electrical Engineering
ISBN:
9780073373843
Author:
Frank D. Petruzella
Publisher:
McGraw-Hill Education
Introductory Circuit Analysis (13th Edition)
Electrical Engineering
ISBN:
9780133923605
Author:
Robert L. Boylestad
Publisher:
PEARSON
Delmar's Standard Textbook Of Electricity
Electrical Engineering
ISBN:
9781337900348
Author:
Stephen L. Herman
Publisher:
Cengage Learning
Programmable Logic Controllers
Electrical Engineering
ISBN:
9780073373843
Author:
Frank D. Petruzella
Publisher:
McGraw-Hill Education

Fundamentals of Electric Circuits
Electrical Engineering
ISBN:
9780078028229
Author:
Charles K Alexander, Matthew Sadiku
Publisher:
McGraw-Hill Education

Electric Circuits. (11th Edition)
Electrical Engineering
ISBN:
9780134746968
Author:
James W. Nilsson, Susan Riedel
Publisher:
PEARSON

Engineering Electromagnetics
Electrical Engineering
ISBN:
9780078028151
Author:
Hayt, William H. (william Hart), Jr, BUCK, John A.
Publisher:
Mcgraw-hill Education,