t (seconds) d (meters) 3 4. 295.1 280.5 256,1 222.0 178.1


Correlation
Correlation defines a relationship between two independent variables. It tells the degree to which variables move in relation to each other. When two sets of data are related to each other, there is a correlation between them.
Linear Correlation
A correlation is used to determine the relationships between numerical and categorical variables. In other words, it is an indicator of how things are connected to one another. The correlation analysis is the study of how variables are related.
Regression Analysis
Regression analysis is a statistical method in which it estimates the relationship between a dependent variable and one or more independent variable. In simple terms dependent variable is called as outcome variable and independent variable is called as predictors. Regression analysis is one of the methods to find the trends in data. The independent variable used in Regression analysis is named Predictor variable. It offers data of an associated dependent variable regarding a particular outcome.
Finding the Best Model. In Exercises 5–16, construct a
Dropping the Ball d (meters) above the ground for an object dropped in a low-gravity vacuum from a height of 300 m. The time t (sec) is the time after the object has been released.

The data shows the time t (second) and distance d (meters).
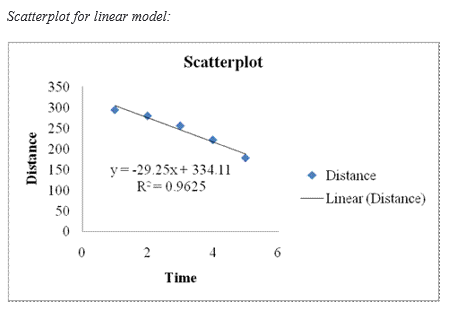
Step-by-step procedure to construct the scatterplot for linear model using the Excel is as follows:
- Select the column containing Time and Distance.
- Choose Insert > Scatter.
- In Scatter, choose Scatter with only markers.
- Select the points in the Scatterplot and then Right click, choose Add Trendline.
- In the Trendline Options, Select Linear.
- Check Display Equation on chart and Display R-squared value on chart.
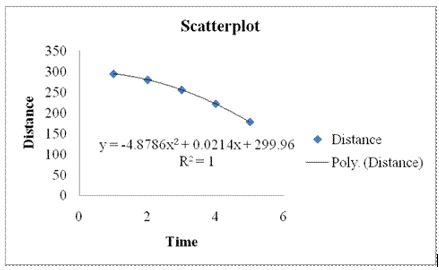
Step-by-step procedure to construct the scatterplot for quadratic model using the Excel is as follows:
- Select the column containing Time and Distance.
- Choose Insert > Scatter.
- In Scatter, choose Scatter with only markers.
- Select the points in the Scatterplot and then Right click, choose Add Trendline.
- In the Trendline Options, Select Polynomial with order 2.
- Check Display Equation on chart and Display R-squared value on chart.
Scatterplot for quadratic model:
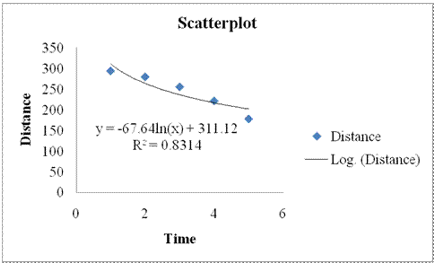
Step-by-step procedure to construct the scatterplot for logarithmic model using the Excel is as follows:
- Select the column containing Time and Distance.
- Choose Insert > Scatter.
- In Scatter, choose Scatter with only markers.
- Select the points in the Scatterplot and then Right click, choose Add Trendline.
- In the Trendline Options, Select Logarithmic.
- Check Display Equation on chart and Display R-squared value on chart.
Scatterplot for logarithmic model:

Step by step
Solved in 6 steps with 6 images


