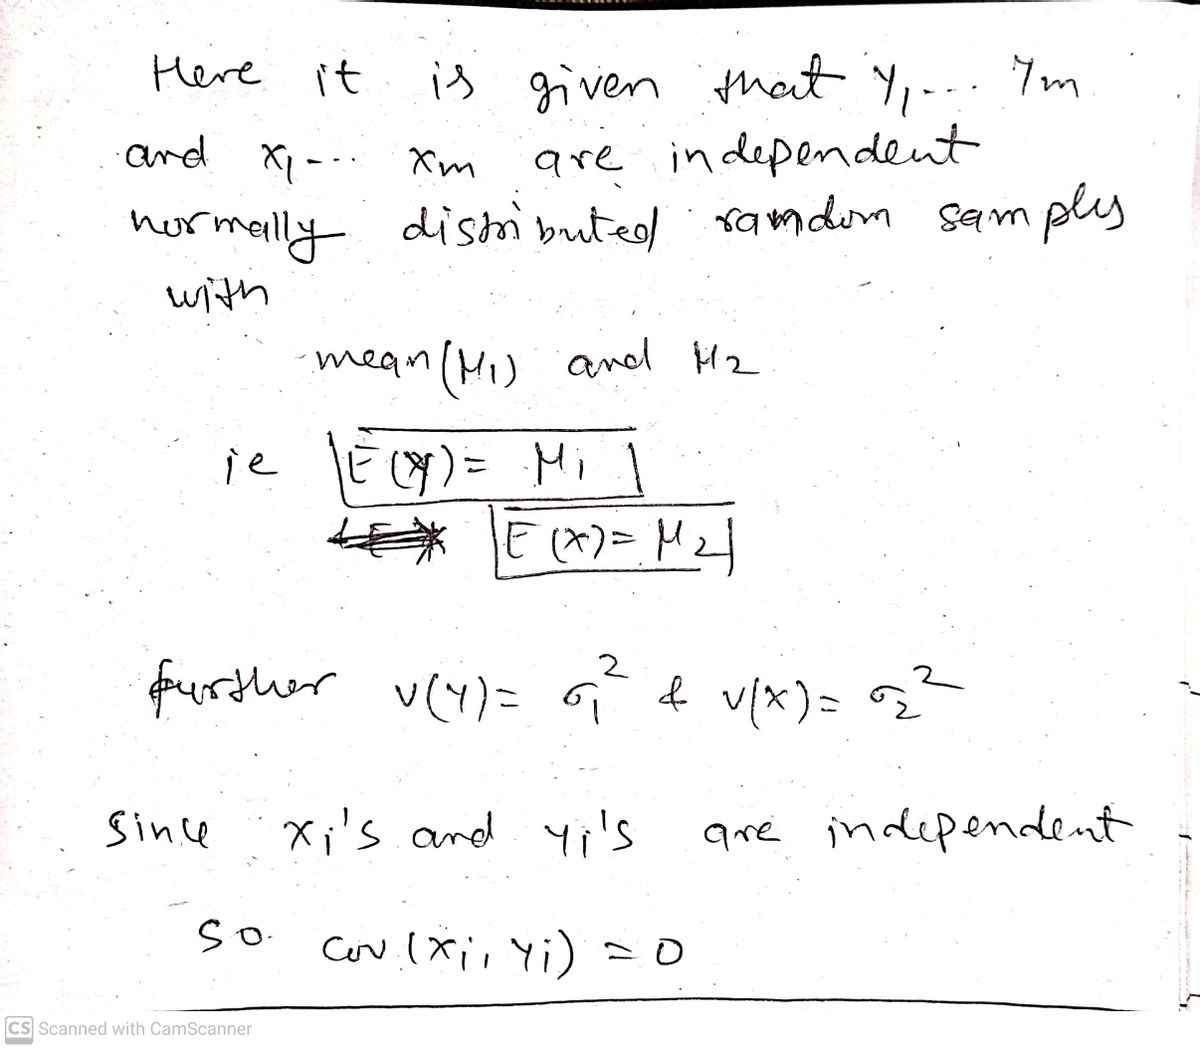
Suppose that Y₁, Y2, ..., Ym and X₁, X₂,..., Xm are independent normally distributed random samples from populations with means μ₁ and μ, and variances σ₁² and σ₂², respectively. Is X - Y a consistent estimator of μ₂ - μ₁?
Q: 1. Researches are interested in whether or not the average fuel economy for compact cars is the same…
A:
Q: 12 You have been asked to determine if two different production processes have different mean…
A: H0 : μ1-μ2≤0HA : μ1-μ2>0n1=36n2=49x¯1=57x¯2=50α=0.05
Q: ht bulb manufacturer wants to compare the mean lifetimes of two of its light bulbs, model A and…
A: Given that Sample sizes n1=11 , n2=13 Sample means X̄1=1323 , X̄2=1366 s1 =95…
Q: Assume that the populations of lifetimes for each model are normally distributed and that the…
A: We want to find the 99% confidence interval
Q: Suppose that you are given two random variables x and y and you take measurements and obtain x1 =…
A: Number of sample observations n = 3 X Y XY X2 Y2 2.3 60 138 5.29 3600 -7.6 120 -912…
Q: What are the two degrees of freedom of the ANOVA? df1= df2= Use FF-distribution to find the…
A: 1. A random sample of 40 seeds from each of the 4 species considered. The two degrees of freedom of…
Q: I. Find the value of the following: Xo.10,2 X0.01.4 1.
A: Hello! As you have posted 2 different questions, we are answering the first question. In case you…
Q: You have been asked to determine if two different production processes have different mean numbers…
A: Please find the explanation below. Thank you.
Q: A manufacturer of sunflower oil uses machines to distribute liquid ingredients into bottles that…
A: Provided information is, a manufacturer of sunflower oil uses machines to distribute liquid…
Q: One sample with n =8 has a S2 = 6 and a second sample n = 8 scores has a S2 = 10. If the pooled…
A:
Q: Suppose that the random variable X measures the number of hot dogs purchased in a food court in an…
A: CorX,Y=0.75VX=VY=36W=2X+3Y
Q: Ө A head teacher wishes to estimate a parameter representing the proportion of her year 6 pupils who…
A: (a) For a Beta distribution with parameters α and β, the mode is given by (α - 1) / (α + β - 2) and…
Q: A light bulb manufacturer wants to compare the mean lifetimes of two of its light bulbs, model A and…
A:
Q: 0 samples with µ = 0 and σ2 = 1.0 Sample variance: 0.022 100 samples with µ = 0 and σ 2 = 1.0…
A:
Q: A light bulb manufacturer wants to compare the mean lifetimes of two of its light bulbs, m were…
A: Analysis of 15 bulbs of model A showed a mean 1352 and standard deviation 88 hours n1=15x1=1352s1=88…
Q: The following table shows the results of two random samples that measured the average number of…
A: Solution: Given information: n1=17 Sample size of Li-ion n2= 14 Sample size of NiMH
Q: In order for a new drug to be sold on the market, the variance of the active ingredient in each dose…
A: Given n=12, s2=0.0055, σ2=0.02
Q: The farmers' association of the Amatole region in the Eastern Cape wants to report on the average…
A: Given that Y1, Y2, Y3, Y4 is a random sample of farms, which is normally distributed with mean μ and…
Q: A new material is being tested for use in the manufacture of electrical conduit, to determine…
A: Here, the crushing strengths are measured for a sample of size 16 of the old material and a sample…
Q: A light bulb manufacturer wants to compare the mean lifetimes of two of its light bulbs, model A and…
A: The following information has been provided: n1=12 n2=14x¯1=1372…
Q: A manufacturing company is interested in buying one of two different kinds of machines for…
A:
Q: For a sheet-metal stamping machine in a certain factory, the time between failures, X, has a mean…
A:
Q: second type by at most 9. Should they use the first type or not? (Assume a=0.1)
A: To determine whether the company should use the first type of plastic, we can perform a hypothesis…
Q: in a given population for beverage drinkers, an individual's per kg expenditure on tea (7) and their…
A: Given that , T and C are two random variables representing individual per kg expenditure on Tea and…
Q: If 8 short range rockets of one kind have a mean target error of x₁ = 98 metres with a standard…
A: a) Explanation: In the given situation, the confidence interval was constructed for difference…
Q: A researcher is using a dependent t-test to evaluate the difference between two treatments. If the…
A: Option C) A small variance for difference scores and a small std.error.
Q: 2. Consider the multiple regression model for n y-data yı, ., Yn (n is sample size) y = X,B1 + X,B2…
A:
Q: You have been asked to determine if two different production processes have different mean numbers…
A: Suppose μ1, μ2 denote the population mean numbers of units produced per hour by process 1 and…
Q: The teachers at a primary school have devised a particular method to teach arithmetic. They want to…
A:
Q: A light bulb manufacturer wants to compare the mean lifetimes of two of its light bulbs, model A and…
A:
Q: If B; is an unbiased estimator of B; is also a consistent estimator of B, then when the sample size…
A: Hello. Since your question has multiple parts, we will solve first question for you. If you want…
Q: Suppose annual demand for a product is normallydistributed, with a mean of 600 and a variance of…
A:
Q: hich of the folllowing statements is necessarily true if yt follows an ARCH(1) process? a) the…
A:
Q: 21. An investor is considering two types of investment. She is quite satisfied that the expected…
A: Given information: n1=7, n2=10s12=225, s22=118
Q: Consider a regression analysis with n = 47 and three potential independent variables. Suppose that…
A: Correlation: It describe the association between two variables. n=47 correlation=0.95
Q: c. Can you reject the null hypothesis, using a probability of Type I error α = 0.05, if the sample…
A: The sample standard deviation for process 1 is 32 and sample standard deviation for process 2 is 34.
Q: A light bulb manufacturer wants to compare the mean lifetimes of two of its light bulbs, model À and…
A:
Q: Consider the performance function Y= 2X1-2X2+8X3 are all normally distributed random variables with…
A: Given that Y=2X1-2X2+8X2 is normally distributed. Mean of Y=E(Y)= 2*10.4-2*11.8+8*11.5 E(Y)=89.2
Q: You have been asked to determine if two different production processes have different mean numbers…
A: The provided information is as follows:The random sample size for the sample 1 is .The sample mean…
Q: C and D only
A: Solution:
Step by step
Solved in 4 steps with 4 images
- Suppose that there are two borrowing strategies from a commercial bank as short-term and long-term. We have two small samples (n1=8 and n2=8) and sampled populations are normal. Standard deviation for the first sample is 200 and for the second one is 150. The researcher wants to determine whether the variation in the customers preferring short-term borrowing differs from the variation in the customers preferring long-term borrowing. (Use 0.10 significance level)Suppose we have two SRSS from two distinct populations and the samples are independent. We measure the same variable for both samples. Suppose both populations of the values of these variables are normally distributed but the means and standard deviations are unknown. For purposes of comparing the two means, we use (a) Two-sample t procedures (b) Matched pairs t procedures (c) z procedures (d) The least-squares regression line (e) None of the above. The answer isSuppose a data set from a bike share company contains the number of daily bike rentals at each of 6 stations for the 23 weekdays of a particular month, i.e. we have Yij for i = 1, ..., 23 and j 1,...6. Write down a hierarchical normal model that can be used to estimate the mean number of bike rentals at each station. You can assume that the unknown variance o? of the number of bike rentals is the same for each station.
- Two computer companies are offering new software to universities. Let X and Y denote the number of software installed in three major universities by these two companies. Suppose that the variance of X is 539, the variance of Yis 754, and the covariance of X and Yis 183.50. a) Calculate the correlation coefficient (p) Select one: a. 0.287 b. 0.857 c. None of the answers d. 0.9281) Suppose the following model y; = B1 + u; Where is assumed to be normally distributed with mean zero and variance ơ² . Calculate analytically, following OLS technique, ß, and Var(ß,).There are two random variables X and Y, and their correlation coefficient pX,Y = 0.7. Now, we have two new random variables A = 2.5X+1 and B = 4Y+2. Please compute the correlation coefficient of A and B, PA,B Please round your answer to one decimal place.
- A manufacturing company is interested in buying one of two different kinds of machines for production purposes. The first machine was run for 20 hours. It produces on average of 40 items per hour with variance of 8 items2. The second machine was run for 15 hours. It produces on average 50 items per hour with variance of 10 items2. Assume that the production per hour for each machine is (approximately) normally distributed and there a homogeneity between the populations' variances of the number of items produced by the 2 machines Compute 90% confidence interval for the difference between the two means. What is the tabulated value What is the S.E value What Is the lower and upper boundA light bulb manufacturer wants to compare the mean lifetimes of two of its light bulbs, model A and model B. Independent random samples of the two models were taken. Analysis of 10 bulbs of model A showed a mean lifetime of 1347 hours and a standard deviation of 92 hours. Analysis of 13 bulbs of model B showed a mean lifetime of 1380 hours and a standard deviation of 111 hours. Assume that the populations of lifetimes for each model are normally distributed and that the variances of these populations are equal. Construct a 95% confidence interval for the difference −μ1μ2 between the mean lifetime μ1 of model A bulbs and the mean lifetime μ2 of model B bulbs. Then find the lower limit and upper limit of the 95% confidence interval. Carry your intermediate computations to at least three decimal places. Round your responses to at least two decimal places. Upper Limit Lower Limit:The variability in the amounts of impurities present in a batch of chemical used for a particular process depends on the length of time the process is in operation. A manufacturer using two production lines, 1 and 2, has made a slight adjustment to line 2, hoping to reduce the variability as well as the average amount of impurities in the chemical. Samples of 25 and 25 measurements from the two batches yield 1.04, respectively 0.51 variances. Do the data present sufficient evidence to indicate that the process variability is less for line 2? Use 5% significance level. Conduct a hypothesis test of the airline executive’s belief. [α = 0.05]
- 5. A quality control engineer found that the inner and outer diameters of their ball bearings, denoted respectively as X and Y, are random variables with E(X|Y = y) = 0.7 – 0.3y inches and Var(X|Y = y) = 0.0004y for all values of y. From his past experience he also knew that the mean and variance of the outer diameters were E(Y) = 0.7 inches, and Var(Y) squared inches. = 0.0001 %3D • (i) What are the conditional random variables, E(X|Y) and Var(X|Y)? • (ii) Find the mean of the inner diameters, E(X). • (ii) Find the variance of the inner diameters, Var(X).5. We don't want predictor variables that are too highly correlated with each other or they are redundant (say ≥±.70) or multicollinear (2±.90), which means the variables are measuring pretty much the same thing so why have them all in the equation. What was the finding for redundancy between SPI Scientist and SPI Practitioner? a. No issue with redundancy since the shared variance between the two variables was only 4% (r2 = .04). b. There was an issue with redundancy between the two variables shared 62% of the variance in the relationship.Consider a regression analysis with n= 51 and four potential independent variables. Suppose that one of the independent variables has a correlation of 0.49 with the dependent variable. Does this imply that this independent variable will have a very small Student's t statistic in the regression analysis with all four predictor variables? Choose all that apply. A. The correlation between the independent variable and the dependent variable could result in a very small Student's t statistic as the correlation creates a high variance. B. Correlation between the independent variable and the dependent variable is not necessarily evidence of a small Student's t statistic. C. A high correlation among the independent variables could result in a very small Student's t statistic as the correlation increases the coefficient standard errors. D. Correlation between the independent variable and the dependent variable is evidence of a small Student's t statistic.