SUMMARY Groups Group 1 Group 2 Group 3 ANOVA Source of Variation Count 15 15 15 SS Sum 727 750 761 df Average Variance 48.46666667 10.26666667 50 11.71428571 13.4952381 50.73333333 MS F
SUMMARY Groups Group 1 Group 2 Group 3 ANOVA Source of Variation Count 15 15 15 SS Sum 727 750 761 df Average Variance 48.46666667 10.26666667 50 11.71428571 13.4952381 50.73333333 MS F
MATLAB: An Introduction with Applications
6th Edition
ISBN:9781119256830
Author:Amos Gilat
Publisher:Amos Gilat
Chapter1: Starting With Matlab
Section: Chapter Questions
Problem 1P
Related questions
Question

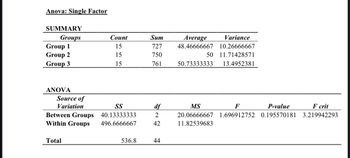
Transcribed Image Text:Anova: Single Factor
SUMMARY
Groups
Group 1
Group 2
Group 3
ANOVA
Source of
Variation
Count
15
15
15
SS
Between Groups 40.13333333
Within Groups
496.6666667
Total
536.8
Sum
727
750
761
df
2
42
44
Average
48.46666667
Variance
10.26666667
50 11.71428571
13.4952381
50.73333333
MS
F
P-value
F crit
20.06666667 1.696912752 0.195570181 3.219942293
11.82539683
Required;
Using a confidence level of 95% with a significance level of 0.05,
i. State in words, the null and alternative hypothesis for this case (Groups 1,2&3).
ii.
Compute the degrees of freedom between groups (Source of Variation).
Expert Solution
This question has been solved!
Explore an expertly crafted, step-by-step solution for a thorough understanding of key concepts.
This is a popular solution!
Trending now
This is a popular solution!
Step by step
Solved in 3 steps

Follow-up Questions
Read through expert solutions to related follow-up questions below.
Follow-up Question
State your decision and make your decision using your P-values
Conclude based on your decision using the hypothesis you have stated above and the P-value from the ANOVA table.

Transcribed Image Text:Anova: Single Factor
SUMMARY
Groups
Group 1
Group 2
Group 3
ANOVA
Source of
Variation
Count
15
15
15
SS
Between Groups 40.13333333
Within Groups
496.6666667
Total
536.8
Sum
727
750
761
df
2
42
44
Average
Variance
48.46666667 10.26666667
50 11.71428571
13.4952381
50.73333333
MS
F
P-value
20.06666667 1.696912752 0.195570181
11.82539683
F crit
3.219942293
Solution
Recommended textbooks for you

MATLAB: An Introduction with Applications
Statistics
ISBN:
9781119256830
Author:
Amos Gilat
Publisher:
John Wiley & Sons Inc

Probability and Statistics for Engineering and th…
Statistics
ISBN:
9781305251809
Author:
Jay L. Devore
Publisher:
Cengage Learning

Statistics for The Behavioral Sciences (MindTap C…
Statistics
ISBN:
9781305504912
Author:
Frederick J Gravetter, Larry B. Wallnau
Publisher:
Cengage Learning

MATLAB: An Introduction with Applications
Statistics
ISBN:
9781119256830
Author:
Amos Gilat
Publisher:
John Wiley & Sons Inc

Probability and Statistics for Engineering and th…
Statistics
ISBN:
9781305251809
Author:
Jay L. Devore
Publisher:
Cengage Learning

Statistics for The Behavioral Sciences (MindTap C…
Statistics
ISBN:
9781305504912
Author:
Frederick J Gravetter, Larry B. Wallnau
Publisher:
Cengage Learning

Elementary Statistics: Picturing the World (7th E…
Statistics
ISBN:
9780134683416
Author:
Ron Larson, Betsy Farber
Publisher:
PEARSON

The Basic Practice of Statistics
Statistics
ISBN:
9781319042578
Author:
David S. Moore, William I. Notz, Michael A. Fligner
Publisher:
W. H. Freeman

Introduction to the Practice of Statistics
Statistics
ISBN:
9781319013387
Author:
David S. Moore, George P. McCabe, Bruce A. Craig
Publisher:
W. H. Freeman