Study: Check if contents of iron are different in two brands of drink. Known standard deviation is about 15 ppm. Same number of bottles are opened from A and B. (n = 33) Brand A: 19 20 10 13 16 12 24 17 19 11 20 14 18 16 16 11 15 19 21 11 21 18 14 16 11 15 6 16 20 15 13 13 24 Brand B: 8 18 17 15 11 14 22 21 12 11 16 22 15 16 14 14 10 16 15 22 15 13 16 13 15 26 17 19 20 22 17 10 11 1. We have a hypothesis: The contents of iron of brand A is 5 ppm lower than brand B: (1) Write down null and alternative hypotheses
Study: Check if contents of iron are different in two brands of drink. Known standard deviation is about 15 ppm. Same number of bottles are opened from A and B. (n = 33)
Brand A: 19 20 10 13 16 12 24 17 19 11 20 14 18 16 16 11 15 19 21 11 21 18 14 16 11 15 6 16 20 15 13 13 24
Brand B: 8 18 17 15 11 14 22 21 12 11 16 22 15 16 14 14 10 16 15 22 15 13 16 13 15 26 17 19 20 22 17 10 11
1. We have a hypothesis: The contents of iron of brand A is 5 ppm lower than brand B:
(1) Write down null and alternative hypotheses
(2) Calculate power of this test. Show your steps. (Suppose effect size is difference only, population is roughly normal)
2. To get power of 90% for the test, how many bottles (A and B) totally we should open? Show your steps.
(1). Null and Alternative hypotheses:
Given data represents the contents of iron for Brand - A and Brand - B.
The investigator is specially interested to test whether the contents of iron of Brand – A is 5 ppm lower than Brand – B.
Denote the mean contents of Brand – A as µ1 and the mean contents of Brand – B as µ2.
The null and alternate hypotheses are stated below:
Null hypothesis H0:
H0 : (µ1 - µ2) ≥ 5 ppm
That is, the mean contents of iron of Brand – A is equal to the mean contents of iron of Brand – B.
Alternative hypothesis H1:
H1 : (µ1 - µ2) < 5 ppm
That is, the mean contents of iron of Brand – A is 5 ppm lower than Brand – B.
Null and alternative hypotheses are given below:

(2). Calculate the power of the test:
Type-II error:
Type-II error is accepting the null hypothesis H0, when the null hypothesis H0 is false. The probability of type-II error is β = 1 – (Power of the test).
A Type II error is accepting the hypothesis that (µ1 - µ2) is equal to 5 ppm when, in fact (µ1 - µ2) is less than 5 ppm.
Here, it is given that the actual value of (µ1 - µ2) is 5 ppm.
Given that the population standard deviation is 15 ppm. Assume that the population variances are equal for Brand – A and Brand - B.
That is, σ1 = σ2 = 15 ppm.
Since, the level of significance is not specified, the prior level of significance α = 0.05 can be used.
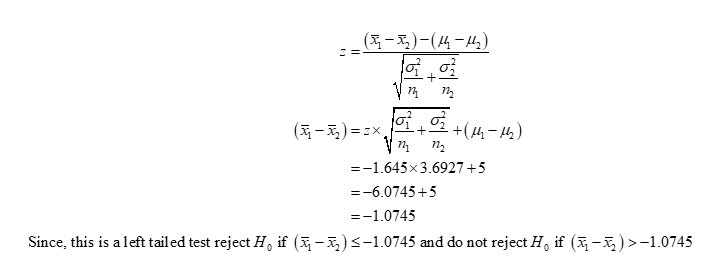
The z-test is used in this case, with level of significance, α = 0.05. This is a left-tailed test. So, the critical value to be used is z0.05 = -1.645 using the EXCEL FORMULA, [NORM.S.INV(0.05)].
The hypothesized mean of the sampling distribution of the sample mean, (µ1 - µ2) is 5 ppm and standard deviation, σ*√(2/n) ≈ 3.6927.
The value of (x1-bar – x2-bar) is obtained as given below:

The power of the test is obtained as given below:

Thus, the power of the test is 0.0499.
Step by step
Solved in 3 steps with 4 images


