Statistics Question


Regression:
The regression analysis is conducted here by using EXCEL. The software procedure is given below:
- Enter the data.
- Select Data > Data Analysis >Regression> OK.
- Enter Input Y Range as weight
- Enter Input X Range as chest size.
- Click OK.
The output using EXCEL is as follows:
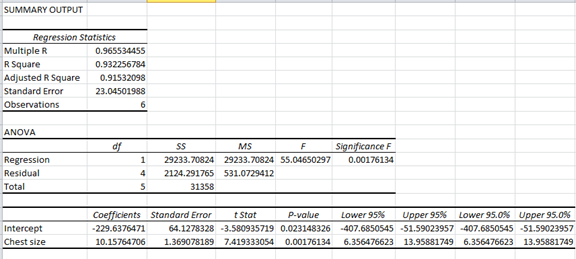
From the output, regression equation is, Weight = –229.6+10.2chest size.
Strategy for Predicting the y value:
Analyze the below mentioned conditions for predicting the y value.
- In scatterplot, the regression line fits the point well.
- The value of r indicates that there is a linear correlation between the variables.
- The prediction value is not away from the range of the given sample data.
If the regression equation satisfies the above mentioned conditions, then the regression is said to be a good model. Here, substitute the given value of x into the regression equation to predict the value of y.
If the regression equation does not satisfy the above conditions, then the regression is not a good model. Here, the best predicted value of y is the value of.
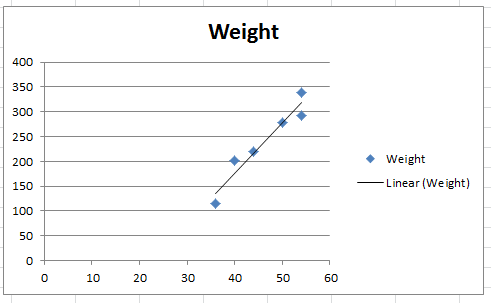
The scatter diagram, along with the best fitted line (least-squares regression line) for the data is as follows:

Step by step
Solved in 3 steps with 2 images


