**Problem 3:** At a drop-in mathematics tutoring center, each teacher sees 4 to 8 students per hour. The probability that a tutor sees 4 students in an hour is 0.117; 5 students, 0.123; 6 students, 0.295; and 7 students, 0.328. a. Find the probability that a tutor sees 8 students in an hour. b. Construct the probability distribution and draw the graph. c. Find the mean, variance, and standard deviation of this distribution. --- **Problem 4:** A financial adviser suggests that his client select one of two types of bonds in which to invest $5000. Bond X pays a return of 4% and has a default rate of 2%. Bond Y has a 2.5% return and a default rate of 1%. Find the expected rate of return and decide which bond would be a better investment. When the bond defaults, the investor loses all the investment.
**Problem 3:** At a drop-in mathematics tutoring center, each teacher sees 4 to 8 students per hour. The probability that a tutor sees 4 students in an hour is 0.117; 5 students, 0.123; 6 students, 0.295; and 7 students, 0.328. a. Find the probability that a tutor sees 8 students in an hour. b. Construct the probability distribution and draw the graph. c. Find the mean, variance, and standard deviation of this distribution. --- **Problem 4:** A financial adviser suggests that his client select one of two types of bonds in which to invest $5000. Bond X pays a return of 4% and has a default rate of 2%. Bond Y has a 2.5% return and a default rate of 1%. Find the expected rate of return and decide which bond would be a better investment. When the bond defaults, the investor loses all the investment.

MATLAB: An Introduction with Applications
6th Edition
ISBN:9781119256830
Author:Amos Gilat
Publisher:Amos Gilat
Chapter1: Starting With Matlab
Section: Chapter Questions
Problem 1P

Related questions
Question

Transcribed Image Text:**Problem 3:**
At a drop-in mathematics tutoring center, each teacher sees 4 to 8 students per hour. The probability that a tutor sees 4 students in an hour is 0.117; 5 students, 0.123; 6 students, 0.295; and 7 students, 0.328.
a. Find the probability that a tutor sees 8 students in an hour.
b. Construct the probability distribution and draw the graph.
c. Find the mean, variance, and standard deviation of this distribution.
---
**Problem 4:**
A financial adviser suggests that his client select one of two types of bonds in which to invest $5000. Bond X pays a return of 4% and has a default rate of 2%. Bond Y has a 2.5% return and a default rate of 1%. Find the expected rate of return and decide which bond would be a better investment. When the bond defaults, the investor loses all the investment.
Expert Solution
Step 1
Since you have asked multiple questions, we will solve the first question for you. If you want any specific question to be solved then please specify the question number or post only that question.
3.
a.
The variable X is defined as the number of students teacher sees in an hour.
It is clear that the total probability should be equal to 1.
The probability that a tutor sees 8 students in an hour is,
Thus, the probability that a tutor sees 8 students in an hour is 0.137.
Step 2
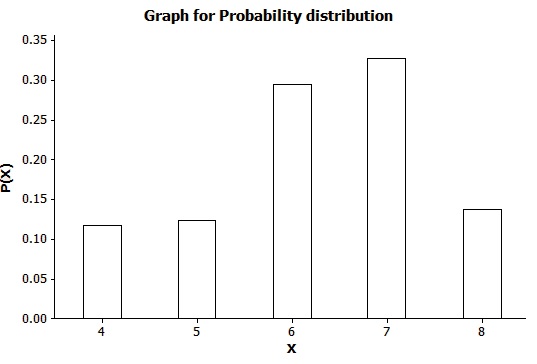
b.
The probability distribution is,
| X | 4 | 5 | 6 | 7 | 8 |
| 0.117 | 0.123 | 0.295 | 0.328 | 0.137 |
The graph is,

Trending now
This is a popular solution!

Step by step
Solved in 3 steps with 1 images

Recommended textbooks for you
MATLAB: An Introduction with Applications
Statistics
ISBN:
9781119256830
Author:
Amos Gilat
Publisher:
John Wiley & Sons Inc

Probability and Statistics for Engineering and th…
Statistics
ISBN:
9781305251809
Author:
Jay L. Devore
Publisher:
Cengage Learning

Statistics for The Behavioral Sciences (MindTap C…
Statistics
ISBN:
9781305504912
Author:
Frederick J Gravetter, Larry B. Wallnau
Publisher:
Cengage Learning
MATLAB: An Introduction with Applications
Statistics
ISBN:
9781119256830
Author:
Amos Gilat
Publisher:
John Wiley & Sons Inc
Probability and Statistics for Engineering and th…
Statistics
ISBN:
9781305251809
Author:
Jay L. Devore
Publisher:
Cengage Learning
Statistics for The Behavioral Sciences (MindTap C…
Statistics
ISBN:
9781305504912
Author:
Frederick J Gravetter, Larry B. Wallnau
Publisher:
Cengage Learning

Elementary Statistics: Picturing the World (7th E…
Statistics
ISBN:
9780134683416
Author:
Ron Larson, Betsy Farber
Publisher:
PEARSON

The Basic Practice of Statistics
Statistics
ISBN:
9781319042578
Author:
David S. Moore, William I. Notz, Michael A. Fligner
Publisher:
W. H. Freeman

Introduction to the Practice of Statistics
Statistics
ISBN:
9781319013387
Author:
David S. Moore, George P. McCabe, Bruce A. Craig
Publisher:
W. H. Freeman