STATEMENTS OF CONDITION ASSETS Cash and Other Cash Items Due from Bangko Sentral Ng Pilipinas Due from Other Banks Interbank Loans Receivable and Securities Purchased Under Agreements to Resell Financial Assets at Fair Value Through Profit or Loss Financial Assets at Fair Value Through Other Comprehensive Income Investment Securities at Amortized Cost, Net Loans and Advances, Net Assets Held for Sale, Net Bank Premises, Furniture, Fixtures and Equipment, Net Investments in Subsidiaries and Associates, Net Assets Attributable to Insurance Operations Deferred Income Tax Assets, Net Other Assets, Net Total Assets LIABILITIES AND CAPITAL FUNDS Deposit Liabilities Derivative Financial Liabilities Bills Payable and Other Borrowed Funds Due to Bangko Sentral ng Pilipinas and Other Banks Manager's Checks and Demand Drafts Outstanding Accrued Taxes, Interest and Other Expenses Liabilities Attributable to Insurance Operations Deferred Credits and Other Liabilities Total liabilities CAPITAL FUNDS ATTRIBUTABLE TO THE EQUITY HOLDERS OF BPI Share capital Share premium Treasury shares Reserves Accumulated other comprehensive loss Surplus NON-CONTROLLING INTERESTS Total capital funds Total liabilities and capital funds 3-Year Average Percentage 37,310,666,667 1.54% 225,228,333,333 9.31% 39,972,333,333 1.65% 24,495,000,000 1.01% 26,892,333,333 1.11% 120,064,666,667 4.96% 334,619,333,333 14% 1,528,976,666,667 63% 3,337,666,667 0.14% 18,570,666,667 0.77% 7,300,666,667 0.30% 18,449,666,667 0.76% 16,698,666,667 0.69% 17,856,333,333 0.74% 2,419,773,000,000 100% 3-Year Average Percentage 1,922,441,666,667 79% 4,528,666,667 0.19% 114,829,666,667 4.75% 1,777,000,000 0.07% 6,931,333,333 0.29% 9,300,666,667 0.38% 14,169,333,333 0.59% 46,822,333,333 1.93% 88% 2,120,800,666,667 46,456,333,333 1.92% 84,607,000,000 3.50% (11,014,333,333) -0.46% 541,333,333 0.02% (9,608,333,333) -0.40% 185,890,333,333 7.68% 296,872,333,333 12% 2,100,000,000 0.09% 298,972,333,333 12% 2,419,773,000,000 100%

FINANCIAL ACCOUNTING
10th Edition
ISBN:9781259964947
Author:Libby
Publisher:Libby
Chapter1: Financial Statements And Business Decisions
Section: Chapter Questions
Problem 1Q
icon
Related questions
icon
Concept explainers
Topic Video
Question

E.x.p.l.a.i.n. .t.h.e. .3.-.y.e.a.r. .a.n.d. .t.h.e. .p.e.r.c.e.n.t.a.g.e. .o.f. .a. .F.i.n.a.n.c.i.a.l. .P.o.s.i.t.i.o.n. .o.f. .t.h.e. .c.o.m.p.a.n.y. .a.n.d. .g.i.v.e. .a. .c.o.n.c.l.u.s.i.o.n. .o.f. .i.t.

STATEMENTS OF CONDITION
ASSETS
Cash and Other Cash Items
Due from Bangko Sentral Ng Pilipinas
Due from Other Banks
Interbank Loans Receivable and Securities Purchased
Under Agreements to Resell
Financial Assets at Fair Value Through Profit or Loss
Financial Assets at Fair Value Through
Other Comprehensive Income
Investment Securities at Amortized Cost, Net
Loans and Advances, Net
Assets Held for Sale, Net
Bank Premises, Furniture, Fixtures and Equipment, Net
Investments in Subsidiaries and Associates, Net
Assets Attributable to Insurance Operations
Deferred Income Tax Assets, Net
Other Assets, Net
Total Assets
LIABILITIES AND CAPITAL FUNDS
Deposit Liabilities
Derivative Financial Liabilities
Bills Payable and Other Borrowed Funds
Due to Bangko Sentral ng Pilipinas and Other Banks
Manager's Checks and Demand Drafts Outstanding
Accrued Taxes, Interest and Other Expenses
Liabilities Attributable to Insurance Operations
Deferred Credits and Other Liabilities
Total liabilities
CAPITAL FUNDS ATTRIBUTABLE TO THE EQUITY HOLDERS OF BPI
Share capital
Share premium
Treasury shares
Reserves
Accumulated other comprehensive loss
Surplus
NON-CONTROLLING INTERESTS
Total capital funds
Total liabilities and capital funds
3-Year Average Percentage
37,310,666,667 1.54%
225,228,333,333 9.31%
39,972,333,333 1.65%
24,495,000,000 1.01%
1.11%
26,892,333,333
120,064,666,667 4.96%
334,619,333,333 14%
1,528,976,666,667 63%
3,337,666,667 0.14%
18,570,666,667 0.77%
7,300,666,667 0.30%
18,449,666,667 0.76%
16,698,666,667 0.69%
17,856,333,333 0.74%
2,419,773,000,000 100%
3-Year Average Percentage
1,922,441,666,667 79%
4,528,666,667 0.19%
114,829,666,667 4.75%
1,777,000,000 0.07%
6,931,333,333 0.29%
9,300,666,667 0.38%
14,169,333,333 0.59%
46,822,333,333 1.93%
88%
2,120,800,666,667
46,456,333,333 1.92%
84,607,000,000 3.50%
(11,014,333,333) -0.46%
541,333,333 0.02%
(9,608,333,333) -0.40%
185,890,333,333 7.68%
296,872,333,333
12%
2,100,000,000 0.09%
298,972,333,333 12%
2,419,773,000,000
100%
Transcribed Image Text:STATEMENTS OF CONDITION ASSETS Cash and Other Cash Items Due from Bangko Sentral Ng Pilipinas Due from Other Banks Interbank Loans Receivable and Securities Purchased Under Agreements to Resell Financial Assets at Fair Value Through Profit or Loss Financial Assets at Fair Value Through Other Comprehensive Income Investment Securities at Amortized Cost, Net Loans and Advances, Net Assets Held for Sale, Net Bank Premises, Furniture, Fixtures and Equipment, Net Investments in Subsidiaries and Associates, Net Assets Attributable to Insurance Operations Deferred Income Tax Assets, Net Other Assets, Net Total Assets LIABILITIES AND CAPITAL FUNDS Deposit Liabilities Derivative Financial Liabilities Bills Payable and Other Borrowed Funds Due to Bangko Sentral ng Pilipinas and Other Banks Manager's Checks and Demand Drafts Outstanding Accrued Taxes, Interest and Other Expenses Liabilities Attributable to Insurance Operations Deferred Credits and Other Liabilities Total liabilities CAPITAL FUNDS ATTRIBUTABLE TO THE EQUITY HOLDERS OF BPI Share capital Share premium Treasury shares Reserves Accumulated other comprehensive loss Surplus NON-CONTROLLING INTERESTS Total capital funds Total liabilities and capital funds 3-Year Average Percentage 37,310,666,667 1.54% 225,228,333,333 9.31% 39,972,333,333 1.65% 24,495,000,000 1.01% 1.11% 26,892,333,333 120,064,666,667 4.96% 334,619,333,333 14% 1,528,976,666,667 63% 3,337,666,667 0.14% 18,570,666,667 0.77% 7,300,666,667 0.30% 18,449,666,667 0.76% 16,698,666,667 0.69% 17,856,333,333 0.74% 2,419,773,000,000 100% 3-Year Average Percentage 1,922,441,666,667 79% 4,528,666,667 0.19% 114,829,666,667 4.75% 1,777,000,000 0.07% 6,931,333,333 0.29% 9,300,666,667 0.38% 14,169,333,333 0.59% 46,822,333,333 1.93% 88% 2,120,800,666,667 46,456,333,333 1.92% 84,607,000,000 3.50% (11,014,333,333) -0.46% 541,333,333 0.02% (9,608,333,333) -0.40% 185,890,333,333 7.68% 296,872,333,333 12% 2,100,000,000 0.09% 298,972,333,333 12% 2,419,773,000,000 100%
Expert Solution
steps

Step by step

Solved in 3 steps

Blurred answer
Follow-up Questions
Read through expert solutions to related follow-up questions below.
Follow-up Question

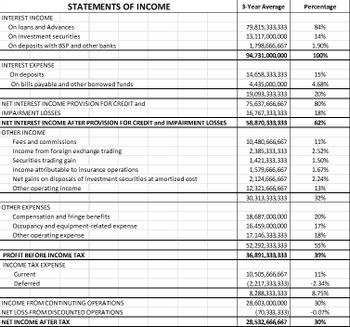
E.x.p.l.a.i.n. .t.h.e. .3.-.y.e.a.r. .a.n.d. .t.h.e. .p.e.r.c.e.n.t.a.g.e. .o.f. .a. .I.n.c.o.m.e. .S.t.a.t.e.m.e.n.t. .o.f. .t.h.e. .c.o.m.p.a.n.y. .a.n.d. .g.i.v.e. .a. .c.o.n.c.l.u.s.i.o.n. .o.f. .i.t.
INTEREST INCOME
On loans and Advances
On investment securities
On deposits with BSP and other banks
STATEMENTS OF INCOME
INTEREST EXPENSE
On deposits
On bills payable and other borrowed funds
NET INTEREST INCOME PROVISION FOR CREDIT and
IMPAIRMENT LOSSES
NET INTEREST INCOME AFTER PROVISION FOR CREDIT and IMPAIRMENT LOSSES
OTHER INCOME
Fees and commissions
Income from foreign exchange trading
Securities trading gain
Income attributable to insurance operations
Net gains on disposals of investment securities at amortized cost
Other operating income
OTHER EXPENSES
Compensation and fringe benefits
Occupancy and equipment-related expense
Other operating expense
PROFIT BEFORE INCOME TAX
INCOME TAX EXPENSE
Current
Deferred
INCOME FROM CONTINUTING OPERATIONS
NET LOSS FROM DISCOUNTED OPERATIONS
NET INCOME AFTER TAX
3-Year Average
79,815,333,333
13,117,000,000
1,798,666,667
94,731,000,000
14,658,333,333
4,435,000,000
19,093,333,333
75,637,666,667
16,767,333,333
58,870,333,333
10,480,666,667
2,385,333,333
1,421,333,333
1,579,666,667
2,124,666,667
12,321,666,667
30,313,333,333
18,687,000,000
16,459,000,000
17,146,333,333
52,292,333,333
36,891,333,333
10,505,666,667
(2,217,333,333)
8,288,333,333
28,603,000,000
(70,333,333)
28,532,666,667
Percentage
84%
14%
1.90%
100%
15%
4.68%
20%
80%
18%
62%
11%
2.52%
1.50%
1.67%
2.24%
13%
32%
20%
17%
18%
55%
39%
11%
-2.34%
8.75%
30%
-0.07%
30%
Transcribed Image Text:INTEREST INCOME On loans and Advances On investment securities On deposits with BSP and other banks STATEMENTS OF INCOME INTEREST EXPENSE On deposits On bills payable and other borrowed funds NET INTEREST INCOME PROVISION FOR CREDIT and IMPAIRMENT LOSSES NET INTEREST INCOME AFTER PROVISION FOR CREDIT and IMPAIRMENT LOSSES OTHER INCOME Fees and commissions Income from foreign exchange trading Securities trading gain Income attributable to insurance operations Net gains on disposals of investment securities at amortized cost Other operating income OTHER EXPENSES Compensation and fringe benefits Occupancy and equipment-related expense Other operating expense PROFIT BEFORE INCOME TAX INCOME TAX EXPENSE Current Deferred INCOME FROM CONTINUTING OPERATIONS NET LOSS FROM DISCOUNTED OPERATIONS NET INCOME AFTER TAX 3-Year Average 79,815,333,333 13,117,000,000 1,798,666,667 94,731,000,000 14,658,333,333 4,435,000,000 19,093,333,333 75,637,666,667 16,767,333,333 58,870,333,333 10,480,666,667 2,385,333,333 1,421,333,333 1,579,666,667 2,124,666,667 12,321,666,667 30,313,333,333 18,687,000,000 16,459,000,000 17,146,333,333 52,292,333,333 36,891,333,333 10,505,666,667 (2,217,333,333) 8,288,333,333 28,603,000,000 (70,333,333) 28,532,666,667 Percentage 84% 14% 1.90% 100% 15% 4.68% 20% 80% 18% 62% 11% 2.52% 1.50% 1.67% 2.24% 13% 32% 20% 17% 18% 55% 39% 11% -2.34% 8.75% 30% -0.07% 30%
Solution
Bartleby Expert
SEE SOLUTION
Knowledge Booster
Financial Statements
Learn more about
Need a deep-dive on the concept behind this application? Look no further. Learn more about this topic, accounting and related others by exploring similar questions and additional content below.
Similar questions
Recommended textbooks for you
FINANCIAL ACCOUNTING
Accounting
ISBN:
9781259964947
Author:
Libby
Publisher:
MCG
Accounting
Accounting
Accounting
ISBN:
9781337272094
Author:
WARREN, Carl S., Reeve, James M., Duchac, Jonathan E.
Publisher:
Cengage Learning,
Accounting Information Systems
Accounting
ISBN:
9781337619202
Author:
Hall, James A.
Publisher:
Cengage Learning,
Horngren's Cost Accounting: A Managerial Emphasis…
Accounting
ISBN:
9780134475585
Author:
Srikant M. Datar, Madhav V. Rajan
Publisher:
PEARSON
Intermediate Accounting
Accounting
ISBN:
9781259722660
Author:
J. David Spiceland, Mark W. Nelson, Wayne M Thomas
Publisher:
McGraw-Hill Education
Financial and Managerial Accounting
Accounting
ISBN:
9781259726705
Author:
John J Wild, Ken W. Shaw, Barbara Chiappetta Fundamental Accounting Principles
Publisher:
McGraw-Hill Education