State the null hypothesis for testing whether there is a difference in average reaction time between the Cell Phone and Control groups. O Ho O Ho: cell O Ho cell O Ho: cell Q5.2 cell-control = 0 control < 0 control control > 0 State the alternative hypothesis for testing whether the average reaction time for those using a Cell Phone is greater than the average reaction time for the Control group. OHA cell-control > 0 OHA cell control < 0 OHA: cell control OHA cell control =
State the null hypothesis for testing whether there is a difference in average reaction time between the Cell Phone and Control groups. O Ho O Ho: cell O Ho cell O Ho: cell Q5.2 cell-control = 0 control < 0 control control > 0 State the alternative hypothesis for testing whether the average reaction time for those using a Cell Phone is greater than the average reaction time for the Control group. OHA cell-control > 0 OHA cell control < 0 OHA: cell control OHA cell control =
MATLAB: An Introduction with Applications
6th Edition
ISBN:9781119256830
Author:Amos Gilat
Publisher:Amos Gilat
Chapter1: Starting With Matlab
Section: Chapter Questions
Problem 1P
Related questions
Question
100%

Transcribed Image Text:Q5 Two-sample t-test
Researchers are interested in whether the use of cell phones while driving impairs driver's
reaction speed. In a simple random sample of 70 drivers, 35 are randomly assigned to the "Cell
Phone" group and the other 35 are assigned to the control group. The drivers assigned to the
control group listened radio while participating in a driving simulator, while the drivers assigned
to the cell group carried out a phone conversation while participating in the simulation. For both
treatments, the participants reacted to various simulated obstacles. The reaction times to the
obstacles were recorded for all participants. The box plot below shows the reaction times for
each group.
Reaction Time
900-
800-
700-
600-
500-
400-
Cell
Group
Control

Transcribed Image Text:Q5.1
Group
Q5.2
Cell
Control
Sample Mean
586
536
Sample Standard
Deviation
97.5
69.0
Sample Size
35
35
State the null hypothesis for testing whether there is a difference in average reaction time
between the Cell Phone and Control groups.
O Ho cell
control = 0
O Ho
cell
control < 0
O Ho
cell
control
O Ho: cell-control > 0
State the alternative hypothesis for testing whether the average reaction time for those using a
Cell Phone is greater than the average reaction time for the Control group.
OHA cell control > 0
OHA cell-control < 0
OHA: μcell = control
OHA cell control
Expert Solution
This question has been solved!
Explore an expertly crafted, step-by-step solution for a thorough understanding of key concepts.
Step by step
Solved in 3 steps

Follow-up Questions
Read through expert solutions to related follow-up questions below.
Follow-up Question

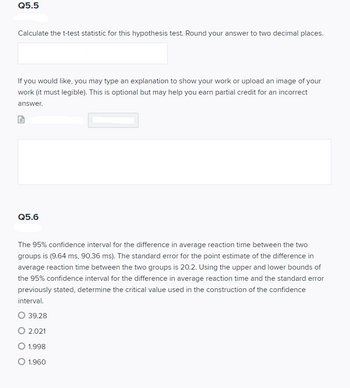
Transcribed Image Text:Q5.5
Calculate the t-test statistic for this hypothesis test. Round your answer to two decimal places.
If you would like, you may type an explanation to show your work or upload an image of your
work (it must legible). This is optional but may help you earn partial credit for an incorrect
answer.
Q5.6
The 95% confidence interval for the difference in average reaction time between the two
groups is (9.64 ms, 90.36 ms). The standard error for the point estimate of the difference in
average reaction time between the two groups is 20.2. Using the upper and lower bounds of
the 95% confidence interval for the difference in average reaction time and the standard error
previously stated, determine the critical value used in the construction of the confidence
interval.
O 39.28
O 2.021
O 1.998
O 1.960

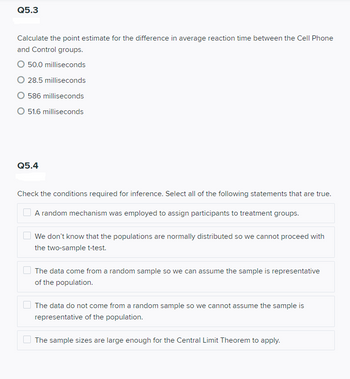
Transcribed Image Text:Q5.3
Calculate the point estimate for the difference in average reaction time between the Cell Phone
and Control groups.
50.0 milliseconds
28.5 milliseconds
O 586 milliseconds
O 51.6 milliseconds
Q5.4
Check the conditions required for inference. Select all of the following statements that are true.
A random mechanism was employed to assign participants to treatment groups.
We don't know that the populations are normally distributed so we cannot proceed with
the two-sample t-test.
The data come from a random sample so we can assume the sample is representative
of the population.
The data do not come from a random sample so we cannot assume the sample is
representative of the population.
The sample sizes are large enough for the Central Limit Theorem to apply.
Solution
Recommended textbooks for you

MATLAB: An Introduction with Applications
Statistics
ISBN:
9781119256830
Author:
Amos Gilat
Publisher:
John Wiley & Sons Inc

Probability and Statistics for Engineering and th…
Statistics
ISBN:
9781305251809
Author:
Jay L. Devore
Publisher:
Cengage Learning

Statistics for The Behavioral Sciences (MindTap C…
Statistics
ISBN:
9781305504912
Author:
Frederick J Gravetter, Larry B. Wallnau
Publisher:
Cengage Learning

MATLAB: An Introduction with Applications
Statistics
ISBN:
9781119256830
Author:
Amos Gilat
Publisher:
John Wiley & Sons Inc

Probability and Statistics for Engineering and th…
Statistics
ISBN:
9781305251809
Author:
Jay L. Devore
Publisher:
Cengage Learning

Statistics for The Behavioral Sciences (MindTap C…
Statistics
ISBN:
9781305504912
Author:
Frederick J Gravetter, Larry B. Wallnau
Publisher:
Cengage Learning

Elementary Statistics: Picturing the World (7th E…
Statistics
ISBN:
9780134683416
Author:
Ron Larson, Betsy Farber
Publisher:
PEARSON

The Basic Practice of Statistics
Statistics
ISBN:
9781319042578
Author:
David S. Moore, William I. Notz, Michael A. Fligner
Publisher:
W. H. Freeman

Introduction to the Practice of Statistics
Statistics
ISBN:
9781319013387
Author:
David S. Moore, George P. McCabe, Bruce A. Craig
Publisher:
W. H. Freeman