Standard Normal Distribution 0.02 0.03 0.04 0.05 0.06 0.07 0.5080 0.5120 0.5160 0.5199 0.5239 0.5636 0.5279 0.5675 0.6064 0.6443 0.6808 0. 0.5478 0.5871 0.6255 0.6628 0.5557 0.5948 0.6331 0.6700 0.5517 0.5596 0. 0.5910 0.6293 0.6664 0.5987 0.6368 0.6736 0.6026 0.6406 0. 0. 0.6772
Standard Normal Distribution 0.02 0.03 0.04 0.05 0.06 0.07 0.5080 0.5120 0.5160 0.5199 0.5239 0.5636 0.5279 0.5675 0.6064 0.6443 0.6808 0. 0.5478 0.5871 0.6255 0.6628 0.5557 0.5948 0.6331 0.6700 0.5517 0.5596 0. 0.5910 0.6293 0.6664 0.5987 0.6368 0.6736 0.6026 0.6406 0. 0. 0.6772
MATLAB: An Introduction with Applications
6th Edition
ISBN:9781119256830
Author:Amos Gilat
Publisher:Amos Gilat
Chapter1: Starting With Matlab
Section: Chapter Questions
Problem 1P
Related questions
Question

Transcribed Image Text:### Standard Normal Distribution Table
The table provided is a portion of the Standard Normal Distribution Table, used to find the cumulative probability associated with a given z-score in a standard normal distribution.
#### Diagram Explanation
At the top of the image is a bell-shaped curve representing the standard normal distribution, which is symmetric around zero. The shaded area under the curve corresponds to the probability of a z-score. The area is marked, and the z-axis is labeled with 'z.'
#### Table V: Standard Normal Distribution
##### Explanation:
- **Columns**: The columns are labeled with z-scores' decimal parts from 0.00 to 0.09.
- **Rows**: Each row represents the integer and first decimal place of a z-score, ranging from 0.0 to 3.4.
##### How to Use:
1. **Find the z-score**: Determine the z-score you need.
2. **Locate the row**: Find the first two digits of the z-score on the leftmost column.
3. **Locate the column**: Use the top row to find the third digit.
4. **Intersect**: The value at the intersection of the row and column gives the cumulative probability for that z-score.
#### Table Details
- The first row of z-scores from 0.0 shows the cumulative probability increases steadily from 0.5000 at 0.0 to 0.5398 at 0.1.
- As z-scores increase, so do the cumulative probability values, reflecting the increasing area under the curve to the left of the z-score.
This table is instrumental for calculations involving the standard normal distribution, such as in hypothesis testing and confidence interval estimation in statistics.

- [Click here to view the standard normal distribution table (page 2)](#)
---
This exercise aids in understanding the application of statistical methods in real-world efficiency settings at service-focused facilities. Use the distribution tables to perform accurate calculations and predict the probabilities for performance evaluations.](/v2/_next/image?url=https%3A%2F%2Fcontent.bartleby.com%2Fqna-images%2Fquestion%2Fe55ca600-6ecd-431e-a2f3-7959f6a21e5c%2F530960e6-2b76-4758-91c5-176af7a7824a%2F8xkk8fm_processed.png&w=3840&q=75)
Transcribed Image Text:**Transcription for Educational Website**
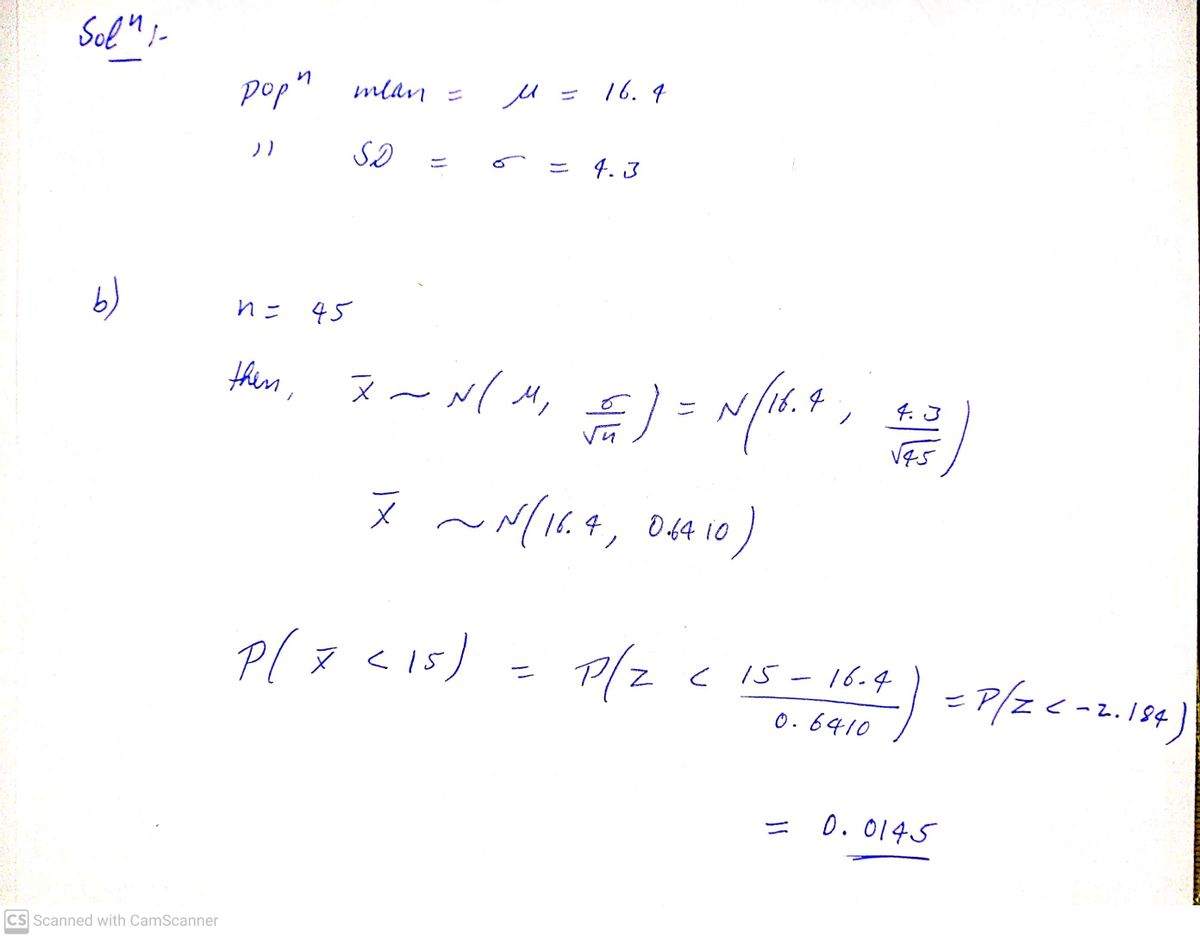
**Understanding Oil-Change Times at a 15-Minute Oil-Change Facility**
The distribution of time required to complete an oil change at a 15-minute oil-change facility is skewed right. Records show that the average time taken is 16.4 minutes, with a standard deviation of 4.3 minutes. Below are some analytical problems based on this data:
---
**Probability Analysis**
**(b) Probability of Sample Mean Time**
Given a sample size \( n = 45 \) for oil changes, what is the probability that the sample mean time is less than 15 minutes?
- The probability is approximately \( 0.0146 \).
- *Note: Round to four decimal places as needed.*
**(c) Setting a Performance Goal**
Suppose the manager offers a $50 bonus to each employee for achieving a specific goal. Typically, on a Saturday, the facility performs 45 oil changes between 10 A.M. and 12 P.M. Considering this as a random sample, determine the mean oil-change time such that there is a 10% chance of being at or below this time. This becomes the target for the manager.
- There would be a 10% chance of being at or below \( \boxed{\phantom{0}} \) minutes.
- *Note: Round to one decimal place as needed.*
**Additional Resources**
- For further assistance, you can view the standard normal distribution tables here:
- [Click here to view the standard normal distribution table (page 1)](#)
- [Click here to view the standard normal distribution table (page 2)](#)
---
This exercise aids in understanding the application of statistical methods in real-world efficiency settings at service-focused facilities. Use the distribution tables to perform accurate calculations and predict the probabilities for performance evaluations.
Expert Solution
Step 1

Step by step
Solved in 2 steps with 2 images

Recommended textbooks for you

MATLAB: An Introduction with Applications
Statistics
ISBN:
9781119256830
Author:
Amos Gilat
Publisher:
John Wiley & Sons Inc

Probability and Statistics for Engineering and th…
Statistics
ISBN:
9781305251809
Author:
Jay L. Devore
Publisher:
Cengage Learning

Statistics for The Behavioral Sciences (MindTap C…
Statistics
ISBN:
9781305504912
Author:
Frederick J Gravetter, Larry B. Wallnau
Publisher:
Cengage Learning

MATLAB: An Introduction with Applications
Statistics
ISBN:
9781119256830
Author:
Amos Gilat
Publisher:
John Wiley & Sons Inc

Probability and Statistics for Engineering and th…
Statistics
ISBN:
9781305251809
Author:
Jay L. Devore
Publisher:
Cengage Learning

Statistics for The Behavioral Sciences (MindTap C…
Statistics
ISBN:
9781305504912
Author:
Frederick J Gravetter, Larry B. Wallnau
Publisher:
Cengage Learning

Elementary Statistics: Picturing the World (7th E…
Statistics
ISBN:
9780134683416
Author:
Ron Larson, Betsy Farber
Publisher:
PEARSON

The Basic Practice of Statistics
Statistics
ISBN:
9781319042578
Author:
David S. Moore, William I. Notz, Michael A. Fligner
Publisher:
W. H. Freeman

Introduction to the Practice of Statistics
Statistics
ISBN:
9781319013387
Author:
David S. Moore, George P. McCabe, Bruce A. Craig
Publisher:
W. H. Freeman