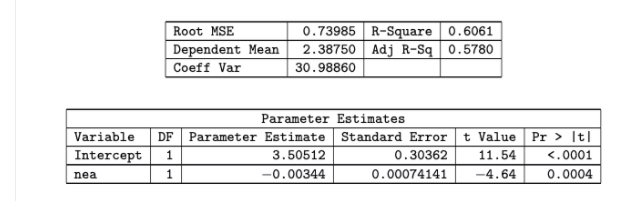
Some people don’t gain weight even when they overeat. Perhaps fidgeting and other “nonexercise activity" (NEA) explains why – the body might spontaneously increase nonexercise activity when fed more. Researchers deliberately overfed 16 healthy young adults for 8 weeks. They measured fat gain (y, in kilograms) and increase in energy use (NEA) (x, in calories), as an explanatory variable, from activity other than deliberated exercise – fidgeting, daily living, and the like. Here are the data (sorted by NEA): NEA increase-94 -57 -29 135 143 151 245 355 ... 620 690 Fat gain 4.2 3.0 3.7 2.7 3.2 3.6 2.4 1.3 2.3 1.1 Assume that the model Fat gain = Bo +B,NEA increase +ɛ is reasonable. Selected SAS output are given here. Root MSE 0.73985 R-Square 0.6061 2.38750 Adj R-Sq 0.5780 Dependent Mean Coeff Var 30.98860 Parameter Estimates Variable DF Parameter Estimate Standard Error t Value Pr > [t]| Intercept 3.50512 0.30362 11.54 <.0001 nea 1 -0.00344 0.00074141 -4.64 0.0004 (a) Find the average fat gain (in grams) for these 16 healthy young adults. (b) Find the estimated standard error of the regression model. (c) Use the model to estimate, if appropriate, the fat gain for Max who has a NEA value of 1000 calories. Repeat the estimate for Jimmy, who has a NEA value of 500 calories.


Correlation
Correlation defines a relationship between two independent variables. It tells the degree to which variables move in relation to each other. When two sets of data are related to each other, there is a correlation between them.
Linear Correlation
A correlation is used to determine the relationships between numerical and categorical variables. In other words, it is an indicator of how things are connected to one another. The correlation analysis is the study of how variables are related.
Regression Analysis
Regression analysis is a statistical method in which it estimates the relationship between a dependent variable and one or more independent variable. In simple terms dependent variable is called as outcome variable and independent variable is called as predictors. Regression analysis is one of the methods to find the trends in data. The independent variable used in Regression analysis is named Predictor variable. It offers data of an associated dependent variable regarding a particular outcome.

Since you have posted a question with multiple sub-parts, we will solve first three sub-parts for you. To get remaining sub-parts solved please repost the complete question and mention the sub-parts to be solved.
Model is given as,
SAS outputs are given,

Trending now
This is a popular solution!

Step by step
Solved in 4 steps with 1 images


