Site 1 vs Site 2 35 T 30 -Site 1 20- 15 10 Site 2
For each statement, say if it is T/F, and if F, say why. Bars represent the 95% confidence interval.
- a) the standard error at site 1 is ~5
- b) a 90% confidence interval would give shorter error bars
- c) the population at site 1 must have a lower standard deviation

Note:
Thank you for the question! Since it is not mentioned in the question whether the variable in the vertical axis is mean, proportion, standard deviation, or some other statistic, we have assumed it to be the mean and solved the problem. However, even if it is any other statistic, the formulae used here would change, but the overall concepts and interpretation would remain similar.
Part 1.a):
Let the sample size for each site be n.
Here, confidence level is, 100(1 – α)% = 95%, so that, (1 – α) = 0.95, or α = 0.05.
The upper α/2-point for the confidence interval of the standard normal variable (the value above which, the probability is α/2), that is, the critical value, cv = zα/2 for α = 0.05 is, z0.05/2 = z0.025 = 1.96.
Assuming that the population standard deviation is σ, the standard error of the sample mean is, se = σ/√n.
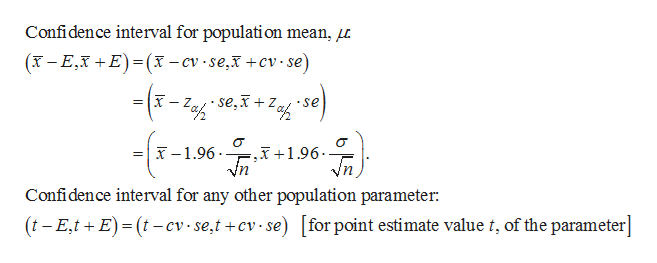
The margin of error is given as: E = cv ∙ se = zα/2 ∙ se = 1.96 ∙ σ/√n (in this case).
The formula for the confidence interval is as follows:

Explanation:
From the given diagram, for site 1, point estimate is 25; t – E1 = 20, t + E1 = 30. So, margin of error, E = 5.
But, E = 1.96 ∙ se for the 95% confidence interval. Evidently, standard error, se = E1/ 1.96 = 5/1.96 ≠ 5.
Thus, the first statement is False.
Trending now
This is a popular solution!
Step by step
Solved in 6 steps with 1 images


