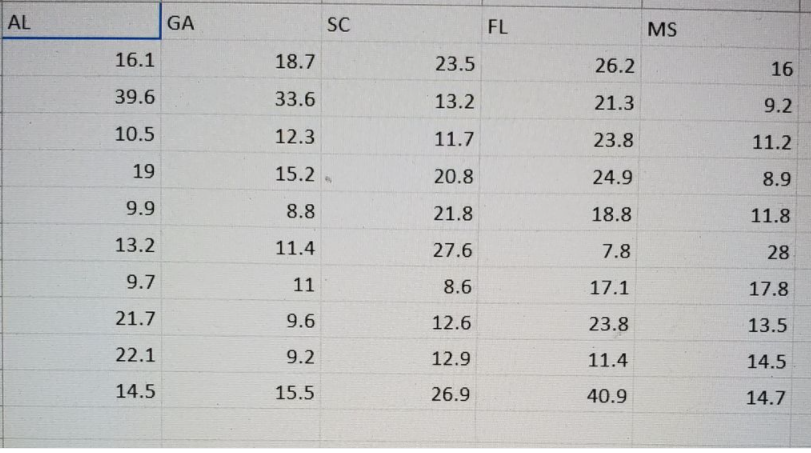
See pictures.  And Solve for   A) which state data contains no outliers as identified by 1.5 IQR rule? B) WHICH STATE data exhibits the greatest variation as measured by range? C)which state data exhibits the least variation as measured by IQR? D) which state daya exhibits the smallest mean value?

MATLAB: An Introduction with Applications
6th Edition
ISBN:9781119256830
Author:Amos Gilat
Publisher:Amos Gilat
Chapter1: Starting With Matlab
Section: Chapter Questions
Problem 1P
icon
Related questions
icon
Concept explainers
Topic Video
Question

See pictures.  And Solve for


A) which state data contains no outliers as identified by 1.5 IQR rule?

B) WHICH STATE data exhibits the greatest variation as measured by range?

C)which state data exhibits the least variation as measured by IQR?

D) which state daya exhibits the smallest mean value?

1.
AL
GA
SC
FL
MS
16.1
18.7
23.5
26.2
16
39.6
33.6
13.2
21.3
9.2
4
10.5
12.3
11.7
23.8
11.2
19
15.2
20.8
24.9
8.9
9.
9.9
8.8
21.8
18.8
11.8
7.
13.2
11.4
27.6
7.8
28
8
9.7
11
8.6
17.1
17.8
9.
21.7
9.6
12.6
23.8
13.5
10
22.1
9.2
12.9
11.4
14.5
11
14.5
15.5
26.9
40.9
14.7
12
E.
A,
2.
3.
Transcribed Image Text:1. AL GA SC FL MS 16.1 18.7 23.5 26.2 16 39.6 33.6 13.2 21.3 9.2 4 10.5 12.3 11.7 23.8 11.2 19 15.2 20.8 24.9 8.9 9. 9.9 8.8 21.8 18.8 11.8 7. 13.2 11.4 27.6 7.8 28 8 9.7 11 8.6 17.1 17.8 9. 21.7 9.6 12.6 23.8 13.5 10 22.1 9.2 12.9 11.4 14.5 11 14.5 15.5 26.9 40.9 14.7 12 E. A, 2. 3.
The US Census Bureau collects a wealth of data describing various aspects of the United States. One
variable that is available is percent of residents holding at least a bachelors degree for each county in
the US. The value of this variable for a random sample of ten counties from five southeastern states was
collected. The resulting data is available at the link given below.
Directions: Right-click on the link and open it in a new browser window or new browser tab. Copy-and-
paste or download the data. To download, click the "File" menu in the top right and choose "Download."
Select your preferred file -- "Microsoft Excel," "Comma-separated values," or "Tab-separated values" are
suggested choices. Open the data in Excel, StatCrunch, or the software of your choice.
Data link:
https://docs.google.com/spreadsheets/d/1uwliDbv_7y2Q59wfOSzcvSJDpt9FPp9Zp5cCF6NU4CE/edit?
usp=sharing
Examine the data and answer the following questions. Use the state abbreviations (AL, GA, FL, MS, and
SC) to indicate your answers.
Hint: Side-by-side boxplots are a good choice for visualizing this data. Calculate appropriate summary
statistics as needed.
Transcribed Image Text:The US Census Bureau collects a wealth of data describing various aspects of the United States. One variable that is available is percent of residents holding at least a bachelors degree for each county in the US. The value of this variable for a random sample of ten counties from five southeastern states was collected. The resulting data is available at the link given below. Directions: Right-click on the link and open it in a new browser window or new browser tab. Copy-and- paste or download the data. To download, click the "File" menu in the top right and choose "Download." Select your preferred file -- "Microsoft Excel," "Comma-separated values," or "Tab-separated values" are suggested choices. Open the data in Excel, StatCrunch, or the software of your choice. Data link: https://docs.google.com/spreadsheets/d/1uwliDbv_7y2Q59wfOSzcvSJDpt9FPp9Zp5cCF6NU4CE/edit? usp=sharing Examine the data and answer the following questions. Use the state abbreviations (AL, GA, FL, MS, and SC) to indicate your answers. Hint: Side-by-side boxplots are a good choice for visualizing this data. Calculate appropriate summary statistics as needed.
Expert Solution
Step 1

Since you have posted a question with multiple sub-parts, we will solve first three sub-parts for you. To get remaining sub-part solved please repost the complete question and mention the sub-parts to be solved.

A wealth of data is given.
Statistics homework question answer, step 1, image 1

steps

Step by step

Solved in 6 steps with 2 images

Blurred answer
Knowledge Booster
Centre, Spread, and Shape of a Distribution
Learn more about
Need a deep-dive on the concept behind this application? Look no further. Learn more about this topic, statistics and related others by exploring similar questions and additional content below.
Recommended textbooks for you
MATLAB: An Introduction with Applications
Statistics
ISBN:
9781119256830
Author:
Amos Gilat
Publisher:
John Wiley & Sons Inc
Probability and Statistics for Engineering and th…
Statistics
ISBN:
9781305251809
Author:
Jay L. Devore
Publisher:
Cengage Learning
Statistics for The Behavioral Sciences (MindTap C…
Statistics
ISBN:
9781305504912
Author:
Frederick J Gravetter, Larry B. Wallnau
Publisher:
Cengage Learning
Elementary Statistics: Picturing the World (7th E…
Statistics
ISBN:
9780134683416
Author:
Ron Larson, Betsy Farber
Publisher:
PEARSON
The Basic Practice of Statistics
Statistics
ISBN:
9781319042578
Author:
David S. Moore, William I. Notz, Michael A. Fligner
Publisher:
W. H. Freeman
Introduction to the Practice of Statistics
Statistics
ISBN:
9781319013387
Author:
David S. Moore, George P. McCabe, Bruce A. Craig
Publisher:
W. H. Freeman