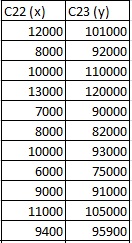
Scatter charts (X versus Y) – Analyze two different and distinct relationships: C22 (X, monthly advertising dollars) versus C23 (Y, monthly revenue dollars), and C24 (X, training hours per year per call center employee) versus C25 (Y, average monthly sales revenue generated per call center employee) C22 C23 C24 C25 12000 101000 0 4779 8000 92000 0 4706 10000 110000 0 4350 13000 120000 20 5189 7000 90000 20 5140 8000 82000 20 4976 10000 93000 30 5110 6000 75000 30 5685 9000 91000 30 5618 11000 105000 40 5995 9400 95900 40 5628 40 5897 50 5746 50 5719 50 5782 60 4895 60 5030 60 4648 33.33333 5271.833
Correlation
Correlation defines a relationship between two independent variables. It tells the degree to which variables move in relation to each other. When two sets of data are related to each other, there is a correlation between them.
Linear Correlation
A correlation is used to determine the relationships between numerical and categorical variables. In other words, it is an indicator of how things are connected to one another. The correlation analysis is the study of how variables are related.
Regression Analysis
Regression analysis is a statistical method in which it estimates the relationship between a dependent variable and one or more independent variable. In simple terms dependent variable is called as outcome variable and independent variable is called as predictors. Regression analysis is one of the methods to find the trends in data. The independent variable used in Regression analysis is named Predictor variable. It offers data of an associated dependent variable regarding a particular outcome.
- Scatter charts (X versus Y) – Analyze two different and distinct relationships: C22 (X, monthly advertising dollars) versus C23 (Y, monthly revenue dollars), and C24 (X, training hours per year per call center employee) versus C25 (Y, average monthly sales revenue generated per call center employee)
| C22 | C23 | C24 | C25 |
| 12000 | 101000 | 0 | 4779 |
| 8000 | 92000 | 0 | 4706 |
| 10000 | 110000 | 0 | 4350 |
| 13000 | 120000 | 20 | 5189 |
| 7000 | 90000 | 20 | 5140 |
| 8000 | 82000 | 20 | 4976 |
| 10000 | 93000 | 30 | 5110 |
| 6000 | 75000 | 30 | 5685 |
| 9000 | 91000 | 30 | 5618 |
| 11000 | 105000 | 40 | 5995 |
| 9400 | 95900 | 40 | 5628 |
| 40 | 5897 | ||
| 50 | 5746 | ||
| 50 | 5719 | ||
| 50 | 5782 | ||
| 60 | 4895 | ||
| 60 | 5030 | ||
| 60 | 4648 | ||
| 33.33333 | 5271.833 | ||
Given data for monthly advertising dollars (x) and monthly revenue dollars (y).
Average: 
Trending now
This is a popular solution!
Step by step
Solved in 2 steps with 4 images


