Sampled Subdivision Number of Mean Bonus Clerical Employees (Dollars) 1 69 83 75 64 3 41 42 4 36 108 59 136 6. 82 102 64 95 8 71 98 2.

MATLAB: An Introduction with Applications
6th Edition
ISBN:9781119256830
Author:Amos Gilat
Publisher:Amos Gilat
Chapter1: Starting With Matlab
Section: Chapter Questions
Problem 1P
icon
Related questions
Topic Video
Question

A union executive wants to estimate the mean value of bonus payments made to a corporation's clerical employees in the first month of a new plan. This corporation has 52 subdivisions, and a simple random sample of 8 of these is taken. Information is then obtained from the payroll records of every clerical worker in each of the sampled subdivisions. The results obtained are shown in the attached table:


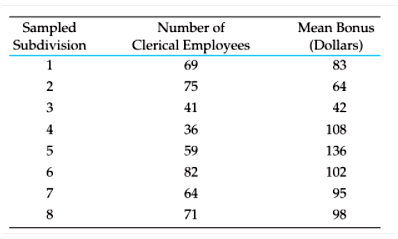
a. Find a point estimate of the population mean bonus per clerical employee for this month.
b. Find a 99% confidence interval for the population mean.

Sampled
Subdivision
Number of
Mean Bonus
Clerical Employees
(Dollars)
1
69
83
75
64
3
41
42
4
36
108
59
136
6.
82
102
64
95
8
71
98
2.
Transcribed Image Text:Sampled Subdivision Number of Mean Bonus Clerical Employees (Dollars) 1 69 83 75 64 3 41 42 4 36 108 59 136 6. 82 102 64 95 8 71 98 2.
Expert Solution
Step 1

Given:

A union executive wants to estimate the mean value of bonus payments made to a corporation's clerical employees in the first month of a new plan. This corporation has 52 subdivisions, and a simple random sample of 8 of these is taken. Information is then obtained from the payroll records of every clerical worker in each of the sampled subdivisions. The results obtained are shown in the attached table:


a. Find a point estimate of the population mean amount of time that televisions are in use in this city.
b. Find a 90% confidence interval for the population mean.

Statistics homework question answer, step 1, image 1

Step 2

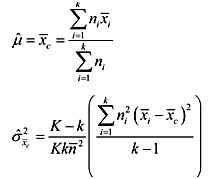
It follows the cluster sampling that involves the mean population estimation. It involves the population being subdivided into K clusters that follows the simple random sampling technique. It follows n1, n2_...nk values based on the population size that is being selected at K clusters. The equation as follows,

Statistics homework question answer, step 2, image 1

Here,

The cluster size is denoted by n

The cluster population mean value being K

Step 3

The equation as follows,

Statistics homework question answer, step 3, image 1

Here,

It follows the unbiased estimators that determine the overall population that includes the mean and variance that follows the population mean. The formula is given as,

Statistics homework question answer, step 3, image 2

Step 4

The value follows the 100(1 - α) %based on the confidence interval with the population mean based on the cluster sampling as follows,

Statistics homework question answer, step 4, image 1

The average time amount in a week involves the television sets that includes the house hold city value with K = 65 precincts. Hence the cluster sampling plan was considered. The value of sample is said to be k=10 precincts yielding the result.

steps

Step by step

Solved in 8 steps with 12 images

Blurred answer
Knowledge Booster
Hypothesis Tests and Confidence Intervals for Means
Learn more about
Need a deep-dive on the concept behind this application? Look no further. Learn more about this topic, statistics and related others by exploring similar questions and additional content below.
Similar questions
  • SEE MORE QUESTIONS
Recommended textbooks for you
MATLAB: An Introduction with Applications
Statistics
ISBN:
9781119256830
Author:
Amos Gilat
Publisher:
John Wiley & Sons Inc
Probability and Statistics for Engineering and th…
Statistics
ISBN:
9781305251809
Author:
Jay L. Devore
Publisher:
Cengage Learning
Statistics for The Behavioral Sciences (MindTap C…
Statistics
ISBN:
9781305504912
Author:
Frederick J Gravetter, Larry B. Wallnau
Publisher:
Cengage Learning
Elementary Statistics: Picturing the World (7th E…
Statistics
ISBN:
9780134683416
Author:
Ron Larson, Betsy Farber
Publisher:
PEARSON
The Basic Practice of Statistics
Statistics
ISBN:
9781319042578
Author:
David S. Moore, William I. Notz, Michael A. Fligner
Publisher:
W. H. Freeman
Introduction to the Practice of Statistics
Statistics
ISBN:
9781319013387
Author:
David S. Moore, George P. McCabe, Bruce A. Craig
Publisher:
W. H. Freeman