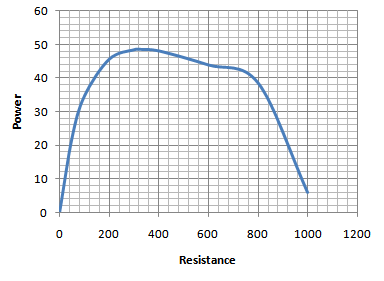
Referring to the plot of Graph 12.1, what value of R, resulted in maximum power transfer to R₁? Record in Table 12.5.
Referring to the plot of Graph 12.1, what value of R, resulted in maximum power transfer to R₁? Record in Table 12.5.

Related questions
Question
need help with graphing this one

Transcribed Image Text:R,
L
Ο Ω
50 Ω
100 Ω
200 Ω
300 Ω
R1 measure = 330 ohm
400 Ω
600 Ω
800 Ω
1000 Ω
V₁
Ου
1. 053 V
1. 86 V
3. 019 V
3.81 V
40
4. 384 V
5. 161 V
5. 554 V
7744 V
P =
VIR
OmW
22. 18 mW
34.596 mW
45. 572mW
48. 39 mW
48. 49mW
48. 05mW
43.88mW
38. 56mW
5.997mW

Transcribed Image Text:60
50
Referring to the plot of Graph 12.1, what value of R₁ resulted in maximum power
transfer to R₁? Record in Table 12.5.
40
30
20
10
0
P (mW)
0.1
0.2
0.3
0.4
0.5
0.6
0.7
0.8
0.9
1.0
R (ΚΩ)
Expert Solution
Step 1: power vs resistance graph
The power vs resistance graph is shown below

Step by step
Solved in 3 steps with 1 images
