Refe of gin The The Table of numbers of girls and probabilities Number of Girls x 0 12345678 Print P(x) 0.004 0.027 0.112 0.223 0.282 0.214 0.102 0.031 0.005 Done I K
Refe of gin The The Table of numbers of girls and probabilities Number of Girls x 0 12345678 Print P(x) 0.004 0.027 0.112 0.223 0.282 0.214 0.102 0.031 0.005 Done I K
MATLAB: An Introduction with Applications
6th Edition
ISBN:9781119256830
Author:Amos Gilat
Publisher:Amos Gilat
Chapter1: Starting With Matlab
Section: Chapter Questions
Problem 1P
Related questions
Question

Transcribed Image Text:**Title: Analyzing the Number of Girls in Multiple Birth Events**
In this educational module, we explore statistical analysis through a specific scenario involving birth data. The problem centers around analyzing the number of girls in groups of eight births from eight different sets of parents. The random variable \( x \) represents the number of girls among these eight children.
### Objective
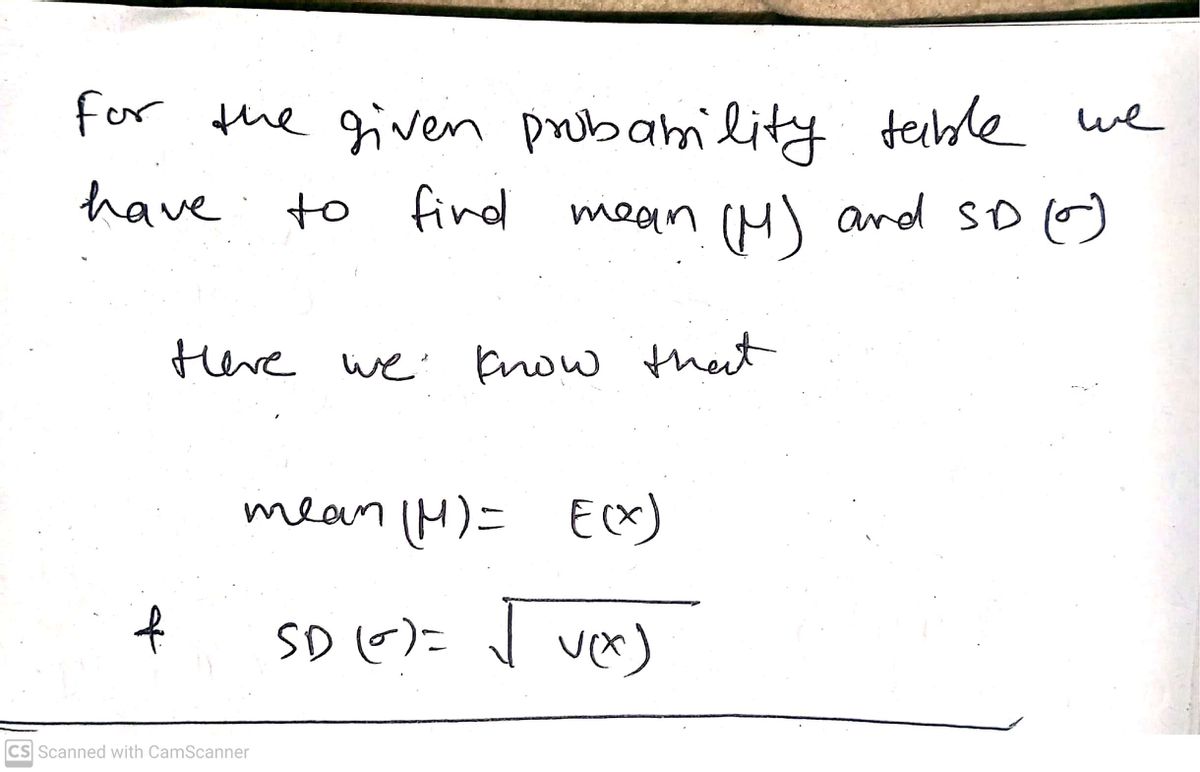
The objective is to determine the mean and standard deviation for the number of girls in these birth sets.
### Instructions
1. **View the Data Table:**
- Click on the icon to access the data table, which will provide the necessary information for the calculations.
2. **Calculate the Mean (\( \mu \)):**
- The mean represents the average number of girls across all sets of eight births.
- You will round your result to one decimal place.
3. **Calculate the Standard Deviation (\( \sigma \)):**
- The standard deviation measures the variability or dispersion of the number of girls from the mean.
- Again, round your result to one decimal place.
By engaging with this exercise, students will gain practical experience in computing fundamental statistical measures, enhancing their understanding of data analysis in real-world contexts.

Transcribed Image Text:**Table of Numbers of Girls and Probabilities**
This table presents the probability distribution for the number of girls, denoted as \(x\), and the corresponding probability \(P(x)\).
| Number of Girls \(x\) | \(P(x)\) |
|-----------------------|----------|
| 0 | 0.004 |
| 1 | 0.027 |
| 2 | 0.112 |
| 3 | 0.223 |
| 4 | 0.282 |
| 5 | 0.214 |
| 6 | 0.102 |
| 7 | 0.031 |
| 8 | 0.005 |
This table can be used to understand the likelihood of various numbers of girls occurring in a given scenario. The probabilities \(P(x)\) indicate how likely each outcome is, with the sum of all probabilities equal to 1.
Expert Solution
Step 1

Step by step
Solved in 3 steps with 3 images

Recommended textbooks for you

MATLAB: An Introduction with Applications
Statistics
ISBN:
9781119256830
Author:
Amos Gilat
Publisher:
John Wiley & Sons Inc

Probability and Statistics for Engineering and th…
Statistics
ISBN:
9781305251809
Author:
Jay L. Devore
Publisher:
Cengage Learning

Statistics for The Behavioral Sciences (MindTap C…
Statistics
ISBN:
9781305504912
Author:
Frederick J Gravetter, Larry B. Wallnau
Publisher:
Cengage Learning

MATLAB: An Introduction with Applications
Statistics
ISBN:
9781119256830
Author:
Amos Gilat
Publisher:
John Wiley & Sons Inc

Probability and Statistics for Engineering and th…
Statistics
ISBN:
9781305251809
Author:
Jay L. Devore
Publisher:
Cengage Learning

Statistics for The Behavioral Sciences (MindTap C…
Statistics
ISBN:
9781305504912
Author:
Frederick J Gravetter, Larry B. Wallnau
Publisher:
Cengage Learning

Elementary Statistics: Picturing the World (7th E…
Statistics
ISBN:
9780134683416
Author:
Ron Larson, Betsy Farber
Publisher:
PEARSON

The Basic Practice of Statistics
Statistics
ISBN:
9781319042578
Author:
David S. Moore, William I. Notz, Michael A. Fligner
Publisher:
W. H. Freeman

Introduction to the Practice of Statistics
Statistics
ISBN:
9781319013387
Author:
David S. Moore, George P. McCabe, Bruce A. Craig
Publisher:
W. H. Freeman