Recent research indicates that the ellectiveness of antidepressant medication is directly related to the severity of the depression (Khan, Brodhead, Kolts & Brown, 2005). Based on pretreatment depression scores, patienes were divided into groups based on their level of depression. Alter receiving the antidepressant medication, depression scores were measured again and the amount of improvement was recorded for each patient. The following data are similar to the resuts the study. Using MS Excel,run the independere measures single factor ANOVA for this data Low Moderate Moderate 1.8 1.6 High Moderately Severe Severe 28 2.9 2.7 31 39 45 2.9 21 25 32 3.7 22 1.5 1.4 36 47 2.1 2.8 0.4 43 Filinthe summary atie for the ANOVA test Raund arsmers for 55 and MS to 3 decimal places) M.S. Between Within TOTAL Also from Excel, obain the necessary statistics for the ANOVA tes:
Recent research indicates that the ellectiveness of antidepressant medication is directly related to the severity of the depression (Khan, Brodhead, Kolts & Brown, 2005). Based on pretreatment depression scores, patienes were divided into groups based on their level of depression. Alter receiving the antidepressant medication, depression scores were measured again and the amount of improvement was recorded for each patient. The following data are similar to the resuts the study. Using MS Excel,run the independere measures single factor ANOVA for this data Low Moderate Moderate 1.8 1.6 High Moderately Severe Severe 28 2.9 2.7 31 39 45 2.9 21 25 32 3.7 22 1.5 1.4 36 47 2.1 2.8 0.4 43 Filinthe summary atie for the ANOVA test Raund arsmers for 55 and MS to 3 decimal places) M.S. Between Within TOTAL Also from Excel, obain the necessary statistics for the ANOVA tes:

MATLAB: An Introduction with Applications
6th Edition
ISBN:9781119256830
Author:Amos Gilat
Publisher:Amos Gilat
Chapter1: Starting With Matlab
Section: Chapter Questions
Problem 1P

Related questions
Question
100%

Transcribed Image Text:Recent research indicates that the effectiveness of antidepressant medication is directly related to the severity of the depression (Khan, Drodhead, Kolts & Brown, 2005). Based on pretreatment depression scores, patients were divided into four
groups based on their level of depression. Alter receiving the antidepressant medication, depression scores were measured again and the amount of improvement was recorded for each patienL. The following data are similar to the results of
the study.
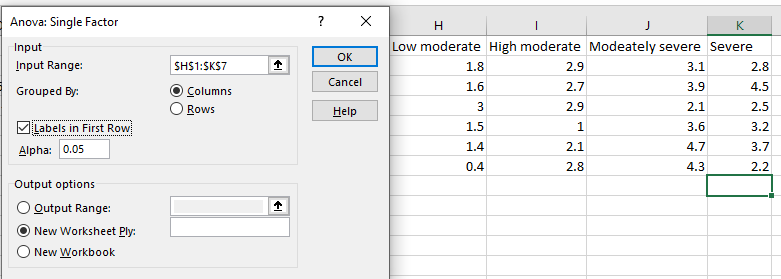
Using MS Excel, run the independent-measures single-factor ANOVA for this data:
High
Moderately
Severe
Low
Moderate
Moderate
Severe
1.8
2.9
2.7
3.1
28
1.6
3.9
45
2.9
21
25
1
2.1
1.5
3.6
32
1.4
4.7
3.7
0.4
2.8
43
22
Fill in the summary lable for the ANOA test
(Round arswers for S5 arnd MS to 3 decimal places,.)
S.S.
df.
M.S.
|Веtween
Within
TOTAL
Also from Excel, obtain the necessary statistics for the ANOVA test:
(Report Pvalue & Fratio accurate to 3 decimal places.)
Fratio:
pvalue:
What is your final conclusion? Lse a significance level of a = 0.05.
ODo not reject Ha. These data do not provide evidence al a difference belween the treatments. Therefore, all treatments are the same (equal).
OReject Ha. There is a significant difference between treatments. All of the treatments are different.
OReject Ha. There is a signilficant difference between treatments. AL least one of the treatments is different.
ODo not reject Ha. These data do not provide evidence al a difference belween the treatments. Continue to assume that all treatments are the same (equal).
Expert Solution
Step 1
Excel Procedure:
Enter the given data in Excel sheet>Data>Data Analysis>Select ‘Anova: single factor’ and click on ‘OK’>Select the data under ‘input range’>Click on ‘OK’.
Excel Output:
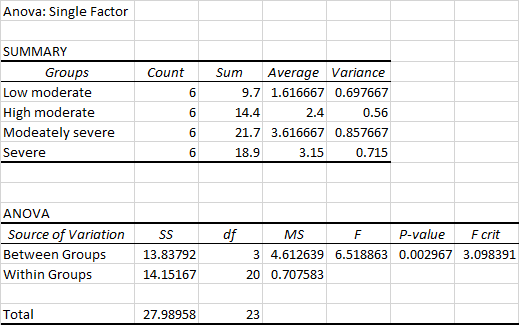
From the output,
| SS | df | MS | |
| Between | 13.838 | 3 | 4.612639 |
| Within | 14.152 | 20 | 0.707583 |
| Total | 27.99 | 23 |
- F ratio: 6.519
- p value: 0.003

Step by step
Solved in 2 steps with 2 images

Knowledge Booster


Learn more about
Need a deep-dive on the concept behind this application? Look no further. Learn more about this topic, statistics and related others by exploring similar questions and additional content below.Recommended textbooks for you
MATLAB: An Introduction with Applications
Statistics
ISBN:
9781119256830
Author:
Amos Gilat
Publisher:
John Wiley & Sons Inc

Probability and Statistics for Engineering and th…
Statistics
ISBN:
9781305251809
Author:
Jay L. Devore
Publisher:
Cengage Learning

Statistics for The Behavioral Sciences (MindTap C…
Statistics
ISBN:
9781305504912
Author:
Frederick J Gravetter, Larry B. Wallnau
Publisher:
Cengage Learning
MATLAB: An Introduction with Applications
Statistics
ISBN:
9781119256830
Author:
Amos Gilat
Publisher:
John Wiley & Sons Inc
Probability and Statistics for Engineering and th…
Statistics
ISBN:
9781305251809
Author:
Jay L. Devore
Publisher:
Cengage Learning
Statistics for The Behavioral Sciences (MindTap C…
Statistics
ISBN:
9781305504912
Author:
Frederick J Gravetter, Larry B. Wallnau
Publisher:
Cengage Learning

Elementary Statistics: Picturing the World (7th E…
Statistics
ISBN:
9780134683416
Author:
Ron Larson, Betsy Farber
Publisher:
PEARSON

The Basic Practice of Statistics
Statistics
ISBN:
9781319042578
Author:
David S. Moore, William I. Notz, Michael A. Fligner
Publisher:
W. H. Freeman

Introduction to the Practice of Statistics
Statistics
ISBN:
9781319013387
Author:
David S. Moore, George P. McCabe, Bruce A. Craig
Publisher:
W. H. Freeman