Questions 1: What does the slope of the graph of friction force versus normal force represent? [Answer this in your lab report]
Questions 1: What does the slope of the graph of friction force versus normal force represent? [Answer this in your lab report]

Related questions
Question
What happens to the normal force and the friction force when the box is pulled at an angle? Compare results from part 1 and part 1 of the tables
![三三三|
兼業
Normal
No Spacing
Heading 1
Heading 2
Data Table. Complete the following table.
Table 1. Friction force when the box is pulled
horizontally
Normal Force
(N)
9.8
14.7
Mass (kg)
Friction Force
(N)
5
1.5
2.0
2.5
3.0
3.5
7.5
19.6
10
24.5
12.5
29.4
34.3
15
17.5
4.0
4.5
39.2
44.1
20
22.5
5.0
49.0
25
Graph of Friction vs. Normal Force (Paste below the graph generated in Step #5 and answer
question #1)
30
25
2 20
15
10
10
15
20
25
30
35
40
45
50
55
Normal Force (N
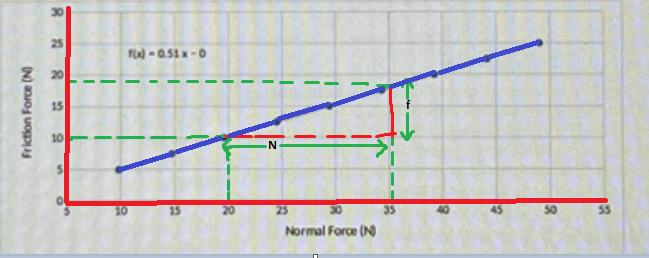
Questions 1: What does the slope of the graph of friction force versus normal force represent?
[Answer this in your lab report]
Part II: Box pulled horizontally
Table 2. Friction when box is pulled at an angle
Normal Force
(N)
8.27
12.42
Mass (kg)
Tension.
Angle
(deg)
Friction Force
(N)
4.23
6.3
8.46
(N)
4.5
20
20
1.5
2.0
6.7
9
20
16.54
2.5
10.52
20
20
20
11.2
13.5
15.7
20.69
24.81
28.97
12.69
14,75
3.0
3.5
33.08
37.24
41.35
20
18
20.2
22.5
16.91
18.98
4.0
20
20
Data Table: Complete Table 2 and then answer question 2.
4.5
5.0
21.14
Friction Force (N](/v2/_next/image?url=https%3A%2F%2Fcontent.bartleby.com%2Fqna-images%2Fquestion%2F5bf39332-46c3-40ce-ab40-5ee9800f371d%2Fd388abe9-635f-46d4-b0d5-faaf4b8a2273%2Fzixtje_processed.jpeg&w=3840&q=75)
Transcribed Image Text:三三三|
兼業
Normal
No Spacing
Heading 1
Heading 2
Data Table. Complete the following table.
Table 1. Friction force when the box is pulled
horizontally
Normal Force
(N)
9.8
14.7
Mass (kg)
Friction Force
(N)
5
1.5
2.0
2.5
3.0
3.5
7.5
19.6
10
24.5
12.5
29.4
34.3
15
17.5
4.0
4.5
39.2
44.1
20
22.5
5.0
49.0
25
Graph of Friction vs. Normal Force (Paste below the graph generated in Step #5 and answer
question #1)
30
25
2 20
15
10
10
15
20
25
30
35
40
45
50
55
Normal Force (N
Questions 1: What does the slope of the graph of friction force versus normal force represent?
[Answer this in your lab report]
Part II: Box pulled horizontally
Table 2. Friction when box is pulled at an angle
Normal Force
(N)
8.27
12.42
Mass (kg)
Tension.
Angle
(deg)
Friction Force
(N)
4.23
6.3
8.46
(N)
4.5
20
20
1.5
2.0
6.7
9
20
16.54
2.5
10.52
20
20
20
11.2
13.5
15.7
20.69
24.81
28.97
12.69
14,75
3.0
3.5
33.08
37.24
41.35
20
18
20.2
22.5
16.91
18.98
4.0
20
20
Data Table: Complete Table 2 and then answer question 2.
4.5
5.0
21.14
Friction Force (N
Expert Solution
Step 1
According to question 1 it has been asked about the slope of the graph representation.
The Y-axis depicts the frictional force f and the X-axis depicts the Normal reaction force

Trending now
This is a popular solution!

Step by step
Solved in 3 steps with 2 images
