question A manufacturer is developing a facility plan to provide production capacity for the factory. the amount of capacity required in the future depends on the number of products demanded by its customers. The data below reflect past sales of its products. a) use simple linear regression to forecast annual demand for the products for each of the nnext 3 years. b) determine the correlation coefficient for the data and interpret its meaning. c) find the coefficient of determination for the data and interprete its meaning. year annual sales (number of products year annual sales (number of products) 1 490 5 461 2 487 6 475 3 492 7 472 4 478 8 458
question A manufacturer is developing a facility plan to provide production capacity for the factory. the amount of capacity required in the future depends on the number of products demanded by its customers. The data below reflect past sales of its products. a) use simple linear regression to forecast annual demand for the products for each of the nnext 3 years. b) determine the correlation coefficient for the data and interpret its meaning. c) find the coefficient of determination for the data and interprete its meaning. year annual sales (number of products year annual sales (number of products) 1 490 5 461 2 487 6 475 3 492 7 472 4 478 8 458
Practical Management Science
6th Edition
ISBN:9781337406659
Author:WINSTON, Wayne L.
Publisher:WINSTON, Wayne L.
Chapter2: Introduction To Spreadsheet Modeling
Section: Chapter Questions
Problem 20P: Julie James is opening a lemonade stand. She believes the fixed cost per week of running the stand...
Related questions
Question
question
A manufacturer is developing a facility plan to provide production capacity for the factory. the amount of capacity required in the future depends on the number of products demanded by its customers. The data below reflect past sales of its products.
a) use simple linear regression to
b) determine the correlation coefficient for the data and interpret its meaning.
c) find the coefficient of determination for the data and interprete its meaning.
| year | annual sales (number of products | year | annual sales (number of products) |
| 1 | 490 | 5 | 461 |
| 2 | 487 | 6 | 475 |
| 3 | 492 | 7 | 472 |
| 4 | 478 | 8 | 458 |
Expert Solution
This question has been solved!
Explore an expertly crafted, step-by-step solution for a thorough understanding of key concepts.
Step by step
Solved in 4 steps with 5 images

Follow-up Questions
Read through expert solutions to related follow-up questions below.
Follow-up Question

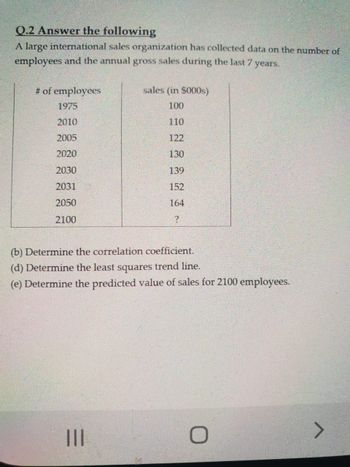
Transcribed Image Text:Q.2 Answer the following
A large international sales organization has collected data on the number of
employees and the annual gross sales during the last 7 years.
# of employees
sales (in $000s)
1975
100
2010
110
2005
122
2020
130
2030
139
2031
152
2050
164
2100
?
(b) Determine the correlation coefficient.
(d) Determine the least squares trend line.
(e) Determine the predicted value of sales for 2100 employees.
|||
>
Solution
Recommended textbooks for you

Practical Management Science
Operations Management
ISBN:
9781337406659
Author:
WINSTON, Wayne L.
Publisher:
Cengage,

Operations Management
Operations Management
ISBN:
9781259667473
Author:
William J Stevenson
Publisher:
McGraw-Hill Education

Operations and Supply Chain Management (Mcgraw-hi…
Operations Management
ISBN:
9781259666100
Author:
F. Robert Jacobs, Richard B Chase
Publisher:
McGraw-Hill Education

Practical Management Science
Operations Management
ISBN:
9781337406659
Author:
WINSTON, Wayne L.
Publisher:
Cengage,

Operations Management
Operations Management
ISBN:
9781259667473
Author:
William J Stevenson
Publisher:
McGraw-Hill Education

Operations and Supply Chain Management (Mcgraw-hi…
Operations Management
ISBN:
9781259666100
Author:
F. Robert Jacobs, Richard B Chase
Publisher:
McGraw-Hill Education


Purchasing and Supply Chain Management
Operations Management
ISBN:
9781285869681
Author:
Robert M. Monczka, Robert B. Handfield, Larry C. Giunipero, James L. Patterson
Publisher:
Cengage Learning

Production and Operations Analysis, Seventh Editi…
Operations Management
ISBN:
9781478623069
Author:
Steven Nahmias, Tava Lennon Olsen
Publisher:
Waveland Press, Inc.