Question 11 When asked what bothers them most about living with another person, women responded: Characteristic Frequency Sloppiness 4 Uneven sharing of chores 20 Irritating personal habits 7 Invasion of Privacy 19 If you were to create a Pareto chart, what would be the order of the characteristics when read from left to right? Group of answer choices Uneven sharing of chores, Irritating personal habits, Invasion of Privacy, Sloppiness Uneven sharing of chores, Invasion of Privacy, Irritating personal habits, Sloppiness Sloppiness, Irritating personal habits, Invasion of Privacy, Uneven sharing of chores Sloppiness, Invasion of Privacy, Irritating personal habits, Uneven sharing of chores Irritating personal habits, Sloppiness, Uneven sharing of chores, Invasion of Privacy Invasion of Privacy, Uneven sharing of chores, Sloppiness, Irritating personal habits Question 15 A random sample of men were weighed and found that the mean weight of this sample was 190 pounds with a standard deviation of 25 pounds. Select the WRONG interpretation of standard deviation. Group of answer choices The weight of all men is within 25 pounds of the mean weight of 190 pounds. The majority of weights of men is within 25 pounds of the mean weight of 190 pounds. The majority of weights of men fall between 165 pounds and 215 pounds. Question 16 Data and summary statistics about college professor’s salaries teaching at the Master’s level was gathered from nine institutions. To better analyze the data was separated by gender to create two mound shaped distributions.  Men had a mean of  $67,691 and standard deviation of $14,506, while women had a mean of $65,323 and a standard deviation of $16,482. Which gender typically has the higher salary?       men or women  Which gender has salaries that vary more?       Men or Women

MATLAB: An Introduction with Applications
6th Edition
ISBN:9781119256830
Author:Amos Gilat
Publisher:Amos Gilat
Chapter1: Starting With Matlab
Section: Chapter Questions
Problem 1P
icon
Related questions
Question

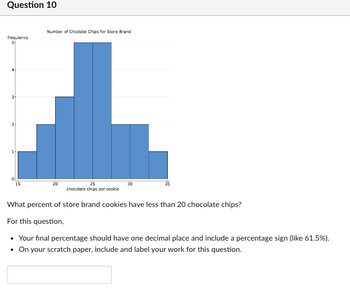
Question 10.

Question 11

When asked what bothers them most about living with another person, women responded:

Characteristic

Frequency

Sloppiness

4

Uneven sharing of chores

20

Irritating personal habits

7

Invasion of Privacy

19

If you were to create a Pareto chart, what would be the order of the characteristics when read from left to right?

Group of answer choices
Uneven sharing of chores, Irritating personal habits, Invasion of Privacy, Sloppiness
Uneven sharing of chores, Invasion of Privacy, Irritating personal habits, Sloppiness
Sloppiness, Irritating personal habits, Invasion of Privacy, Uneven sharing of chores
Sloppiness, Invasion of Privacy, Irritating personal habits, Uneven sharing of chores
Irritating personal habits, Sloppiness, Uneven sharing of chores, Invasion of Privacy
Invasion of Privacy, Uneven sharing of chores, Sloppiness, Irritating personal habits
Question 15
A random sample of men were weighed and found that the mean weight of this sample was 190 pounds with a standard deviation of 25 pounds. Select the WRONG interpretation of standard deviation.
Group of answer choices
The weight of all men is within 25 pounds of the mean weight of 190 pounds.
The majority of weights of men is within 25 pounds of the mean weight of 190 pounds.
The majority of weights of men fall between 165 pounds and 215 pounds.
Question 16

Data and summary statistics about college professor’s salaries teaching at the Master’s level was gathered from nine institutions. To better analyze the data was separated by gender to create two mound shaped distributions.  Men had a mean of  $67,691 and standard deviation of $14,506, while women had a mean of $65,323 and a standard deviation of $16,482.

Which gender typically has the higher salary?       men or women 

Which gender has salaries that vary more?       Men or Women 


Question 10
frequiency
5
4
3-
H
15
Number of Chcolate Chips for Store Brand
20
25
chocolate chips per cookie
30
35
What percent of store brand cookies have less than 20 chocolate chips?
For this question,
• Your final percentage should have one decimal place and include a percentage sign (like 61.5%).
• On your scratch paper, include and label your work for this question.
Transcribed Image Text:Question 10 frequiency 5 4 3- H 15 Number of Chcolate Chips for Store Brand 20 25 chocolate chips per cookie 30 35 What percent of store brand cookies have less than 20 chocolate chips? For this question, • Your final percentage should have one decimal place and include a percentage sign (like 61.5%). • On your scratch paper, include and label your work for this question.
Expert Solution
trending now

Trending now

This is a popular solution!

steps

Step by step

Solved in 2 steps

Blurred answer
Follow-up Questions
Read through expert solutions to related follow-up questions below.
Follow-up Question
Question 10
che chir
What percent of store brand cookies have less than 20 chocolate chips?
For this question,
• Your final percentage should have one decimal place and include a percentage sign (like 61.5%).
. On your scratch paper, include and label your work for this question.
Transcribed Image Text:Question 10 che chir What percent of store brand cookies have less than 20 chocolate chips? For this question, • Your final percentage should have one decimal place and include a percentage sign (like 61.5%). . On your scratch paper, include and label your work for this question.
Solution
Bartleby Expert
SEE SOLUTION
Similar questions
Recommended textbooks for you
MATLAB: An Introduction with Applications
Statistics
ISBN:
9781119256830
Author:
Amos Gilat
Publisher:
John Wiley & Sons Inc
Probability and Statistics for Engineering and th…
Statistics
ISBN:
9781305251809
Author:
Jay L. Devore
Publisher:
Cengage Learning
Statistics for The Behavioral Sciences (MindTap C…
Statistics
ISBN:
9781305504912
Author:
Frederick J Gravetter, Larry B. Wallnau
Publisher:
Cengage Learning
Elementary Statistics: Picturing the World (7th E…
Statistics
ISBN:
9780134683416
Author:
Ron Larson, Betsy Farber
Publisher:
PEARSON
The Basic Practice of Statistics
Statistics
ISBN:
9781319042578
Author:
David S. Moore, William I. Notz, Michael A. Fligner
Publisher:
W. H. Freeman
Introduction to the Practice of Statistics
Statistics
ISBN:
9781319013387
Author:
David S. Moore, George P. McCabe, Bruce A. Craig
Publisher:
W. H. Freeman