Q4. The following data are from a completely randomized design. At the α = 0.1, test whether the means for the three treatments are equal. Need help with last 3 sub part questions please (B, C, D) Treatment 1 Treatment 2 Treatment 3 34 40 42 32 36 40 35 43 48 38 40 36 Sample mean 34.75 39.75 41.5 Sample variance 6.25 8.25 25 (A). What is the F test statistics value? (a) 2.9312 (b) 4.9312 (c) 4.2769 (d) 3.7278 (e) None of the above (B). Using F table, what is the most possible range of values of the p-value? (a) p-value>0.1 (b) 0.05LSD (c) Yes, because 1.75≠0 (d) Yes, because 39.75≠41.5 (e) No, because 39.75<41.5
Q4. The following data are from a completely randomized design. At the α = 0.1, test whether the means for the three treatments are equal.
Need help with last 3 sub part questions please (B, C, D)
|
Treatment 1 |
Treatment 2 |
Treatment 3 |
|
|---|---|---|---|
| 34 | 40 | 42 | |
| 32 | 36 | 40 | |
| 35 | 43 | 48 | |
| 38 | 40 | 36 | |
|
Sample |
34.75 | 39.75 | 41.5 |
|
Sample variance |
6.25 | 8.25 | 25 |
(A). What is the F test statistics value?
(a) 2.9312
(b) 4.9312
(c) 4.2769
(d) 3.7278
(e) None of the above
(B). Using F table, what is the most possible
(a) p-value>0.1
(b) 0.05<p-value<0.1
(c) 0.01<p-value<0.05
(d) 0.025<p-value<0.05
(e) None of the above
(C). What is the Fisher’s LSD value?
(a) 8.3449
(b) 4.7031
(c) 5.8206
(d) 3.7449
(e) None of the above
(D). Is there a significant difference between the means for treatments 2 and 3?
(a) No, because 1.75<LSD
(b) Yes, because 1.75>LSD
(c) Yes, because 1.75≠0
(d) Yes, because 39.75≠41.5
(e) No, because 39.75<41.5
- From the provided information , following table is obtained:
| Treatment 1 | Treatment 2 | Treatment 3 | |
| 34 | 40 | 42 | |
| 32 | 36 | 40 | |
| 35 | 43 | 48 | |
| 38 | 40 | 36 | |
| Sum = | 139 | 159 | 166 |
| Average = | 34.75 | 39.75 | 41.5 |
| 4849 | 6345 | 6964 | |
| St. Dev. = | 2.5 | 2.872 | 5 |
| SS = | 18.75 | 24.75 | 75 |
| n = | 4 | 4 | 4 |
- The total sample size is . Therefore, the total degrees of freedom are:
- Also, the between-groups degrees of freedom are , and the within-groups degrees of freedom are:
- First, we need to compute the total sum of values and the grand mean. The following is obtained

- Also, the sum of squared values is

- Based on the above calculations, the total sum of squares is computed as follows

- The within sum of squares is computed as shown in the calculation below:

- The between sum of squares is computed directly .
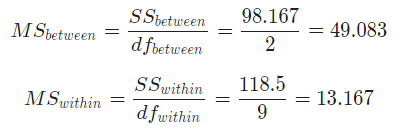
- Now that sum of squares are computed, we can proceed with computing the mean sum of squares:

- Finally, with having already calculated the mean sum of squares, the F-statistic is computed as follows:

Step by step
Solved in 4 steps with 8 images


