• Plot Acceleration (vertical axis) vs. Force (horizontal axis). ● Include an appropriate title, to label each axis (including appropriate units) Include a line of best fit (with the y-intercept set to "zero")

icon
Related questions
Question
### Table: Physics Experiment Data on Mass, Time, Acceleration, and Force

This table presents data from a physics experiment examining the relationship between mass, fall time, acceleration, and net force for a system consisting of a cart and a hanging mass. 

| **Trial #** | **Total Cart Mass (kg)** | **Hanging Mass (kg)** | **Total System Mass (kg)** | **Fall Time (s)** | **Acceleration of System (m/s²)** | **Net Force on System (N)** |
|-------------|---------------------------|------------------------|-----------------------------|-------------------|---------------------------------|----------------------------|
| 1           | 0.50                      | 0.05                   | 0.55                        | 15.23             | 0.89                            | 0.49                       |
| 2           | 0.45                      | 0.10                   | 0.55                        | 10.73             | 1.78                            | 0.98                       |
| 3           | 0.40                      | 0.15                   | 0.55                        | 8.77              | 2.67                            | 1.47                       |
| 4           | 0.35                      | 0.20                   | 0.55                        | 7.59              | 3.56                            | 1.96                       |
| 5           | 0.30                      | 0.25                   | 0.55                        | 6.84              | 4.45                            | 2.45                       |
| 6           | 0.25                      | 0.30                   | 0.55                        | 6.25              | 5.35                            | 2.94                       |

**Explanation:**
- **Total Cart Mass and Hanging Mass**: These columns depict the mass of the cart and the additional mass that is hanging, respectively. 
- **Total System Mass**: This remains constant at 0.55 kg across all trials, indicating a controlled experiment with only the hanging mass varied.
- **Fall Time**: The time taken for the system to complete its designated action, measured in seconds.
- **Acceleration**: Measured in meters per second squared (m/s²), showing how the velocity of the system changes over time.
- **Net Force**: Measured in Newtons (
Transcribed Image Text:### Table: Physics Experiment Data on Mass, Time, Acceleration, and Force This table presents data from a physics experiment examining the relationship between mass, fall time, acceleration, and net force for a system consisting of a cart and a hanging mass. | **Trial #** | **Total Cart Mass (kg)** | **Hanging Mass (kg)** | **Total System Mass (kg)** | **Fall Time (s)** | **Acceleration of System (m/s²)** | **Net Force on System (N)** | |-------------|---------------------------|------------------------|-----------------------------|-------------------|---------------------------------|----------------------------| | 1 | 0.50 | 0.05 | 0.55 | 15.23 | 0.89 | 0.49 | | 2 | 0.45 | 0.10 | 0.55 | 10.73 | 1.78 | 0.98 | | 3 | 0.40 | 0.15 | 0.55 | 8.77 | 2.67 | 1.47 | | 4 | 0.35 | 0.20 | 0.55 | 7.59 | 3.56 | 1.96 | | 5 | 0.30 | 0.25 | 0.55 | 6.84 | 4.45 | 2.45 | | 6 | 0.25 | 0.30 | 0.55 | 6.25 | 5.35 | 2.94 | **Explanation:** - **Total Cart Mass and Hanging Mass**: These columns depict the mass of the cart and the additional mass that is hanging, respectively. - **Total System Mass**: This remains constant at 0.55 kg across all trials, indicating a controlled experiment with only the hanging mass varied. - **Fall Time**: The time taken for the system to complete its designated action, measured in seconds. - **Acceleration**: Measured in meters per second squared (m/s²), showing how the velocity of the system changes over time. - **Net Force**: Measured in Newtons (
Using collected data, construct a line graph and a scatterplot that tracks the relationship between the calculated acceleration of the system and the calculated net force on the system. Be sure to:

- Plot Acceleration (vertical axis) vs. Force (horizontal axis).
- Include an appropriate title, to label each axis (including appropriate units).
- Include a line of best fit (with the y-intercept set to "zero").
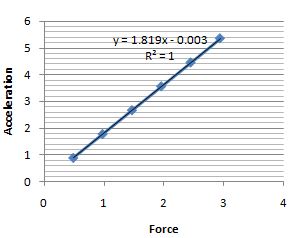
Transcribed Image Text:Using collected data, construct a line graph and a scatterplot that tracks the relationship between the calculated acceleration of the system and the calculated net force on the system. Be sure to: - Plot Acceleration (vertical axis) vs. Force (horizontal axis). - Include an appropriate title, to label each axis (including appropriate units). - Include a line of best fit (with the y-intercept set to "zero").
Expert Solution
Step 1: Acceleration vs Force

Advanced Physics homework question answer, step 1, image 1

steps

Step by step

Solved in 3 steps with 1 images

Blurred answer