P QUESTION 13 The following computer output was used as a part of the model adequacy check for a randomzed complete block design. Conduct the appropriate hypothesis testing based on the output using the standard 6-5 The GLM Procedure Dependent Variable: strength Source Treatment Block q DF 55 3 1 Error 164 Corrected 223 Total Sum of Mean Square Squares 2387 1809 162 8019 12377 ✓ 43.4 603.0 161.7 48.9 For the toolbar, press ALT+F10 (PC) or ALT+FN+F10 (Mac). BIUS Paragraph. V Arial ΠΠΩ X F Value == 0.888 12.332 3.306 V Pr>F 0.6904 <0.001 0.0709 10pt √ 8E EXE 89 63 39H > !!! E TO) A 3 K V I XQ 52 x²
P QUESTION 13 The following computer output was used as a part of the model adequacy check for a randomzed complete block design. Conduct the appropriate hypothesis testing based on the output using the standard 6-5 The GLM Procedure Dependent Variable: strength Source Treatment Block q DF 55 3 1 Error 164 Corrected 223 Total Sum of Mean Square Squares 2387 1809 162 8019 12377 ✓ 43.4 603.0 161.7 48.9 For the toolbar, press ALT+F10 (PC) or ALT+FN+F10 (Mac). BIUS Paragraph. V Arial ΠΠΩ X F Value == 0.888 12.332 3.306 V Pr>F 0.6904 <0.001 0.0709 10pt √ 8E EXE 89 63 39H > !!! E TO) A 3 K V I XQ 52 x²
MATLAB: An Introduction with Applications
6th Edition
ISBN:9781119256830
Author:Amos Gilat
Publisher:Amos Gilat
Chapter1: Starting With Matlab
Section: Chapter Questions
Problem 1P
Related questions
Question

Transcribed Image Text:**Question 13**
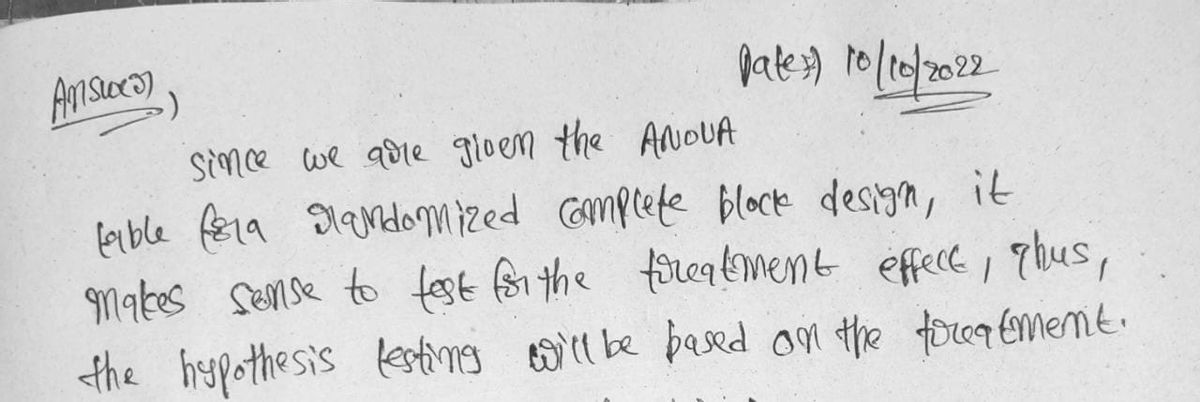
The following computer output was used as a part of the model adequacy check for a randomized complete block design. Conduct the appropriate hypothesis testing based on the output using the standard 6-step approach.
**The GLM Procedure**
Dependent Variable: strength
| Source | DF | Sum of Squares | Mean Square | F Value | Pr > F |
|-------------|-----|----------------|-------------|---------|--------|
| Treatment | 55 | 2387 | 43.4 | 0.888 | 0.6904 |
| Block | 3 | 1809 | 603.0 | 12.332 | <0.001 |
| Error | 164 | 8019 | 48.9 | | |
| Corrected Total | 223 | 12377 | | | |
### Explanation
The table presents the analysis of variance (ANOVA) results from a generalized linear model (GLM) procedure. The dependent variable is "strength." The ANOVA table includes the following columns:
- **DF (Degrees of Freedom):** Represents the number of independent values that can vary in the calculation.
- **Sum of Squares:** Reflects the variability due to each source.
- **Mean Square:** Calculated by dividing the sum of squares by the corresponding degrees of freedom.
- **F Value:** The ratio of the mean square of the source to the mean square error, used to determine statistical significance.
- **Pr > F:** The p-value for the F-test, indicating the probability of observing the given result by chance.
**Toolbar Note:** Instructions are provided for accessing the toolbar using keyboard shortcuts on PC and Mac.
**Submission Note:** Instructions are given to save and submit the answers using the provided options.
Expert Solution
Step 1

Step by step
Solved in 2 steps with 2 images

Recommended textbooks for you

MATLAB: An Introduction with Applications
Statistics
ISBN:
9781119256830
Author:
Amos Gilat
Publisher:
John Wiley & Sons Inc

Probability and Statistics for Engineering and th…
Statistics
ISBN:
9781305251809
Author:
Jay L. Devore
Publisher:
Cengage Learning

Statistics for The Behavioral Sciences (MindTap C…
Statistics
ISBN:
9781305504912
Author:
Frederick J Gravetter, Larry B. Wallnau
Publisher:
Cengage Learning

MATLAB: An Introduction with Applications
Statistics
ISBN:
9781119256830
Author:
Amos Gilat
Publisher:
John Wiley & Sons Inc

Probability and Statistics for Engineering and th…
Statistics
ISBN:
9781305251809
Author:
Jay L. Devore
Publisher:
Cengage Learning

Statistics for The Behavioral Sciences (MindTap C…
Statistics
ISBN:
9781305504912
Author:
Frederick J Gravetter, Larry B. Wallnau
Publisher:
Cengage Learning

Elementary Statistics: Picturing the World (7th E…
Statistics
ISBN:
9780134683416
Author:
Ron Larson, Betsy Farber
Publisher:
PEARSON

The Basic Practice of Statistics
Statistics
ISBN:
9781319042578
Author:
David S. Moore, William I. Notz, Michael A. Fligner
Publisher:
W. H. Freeman

Introduction to the Practice of Statistics
Statistics
ISBN:
9781319013387
Author:
David S. Moore, George P. McCabe, Bruce A. Craig
Publisher:
W. H. Freeman