owing figures represent the number of positive signals of water availability from an under exploration location for twenty different tests. 20 14 21 29 43 17 15 26 8 14 39 23 16 46 28 11 26 35 26 28 Using a 5% significanc


- The following figures represent the number of positive signals of water availability from an under exploration location for twenty different tests.
20 14 21 29 43 17 15 26 8 14
39 23 16 46 28 11 26 35 26 28
- Using a 5% significance level, test the hypothesis that the
mean of the positive signals is more than 20. - Using a 5% significance level, test the hypothesis that the mean of the positive signals is different from 20.
a).
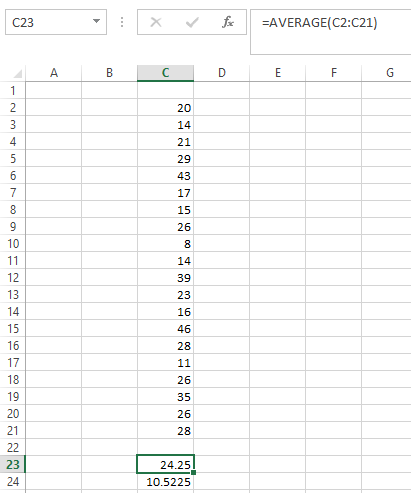
The raw data is given to us. Hence, first we need to find the Mean and Standard deviation of this sample. I will use EXCEL to obtain mean and standard deviation.
Use the formula "=AVERAGE( Range of data set)" in Excel to obtain the mean of the sample. The answer obtained is 24.25
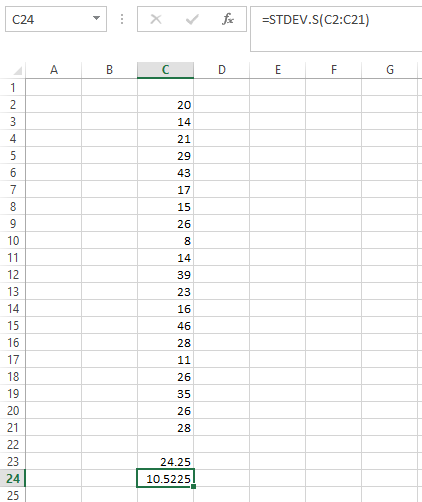
Use the formula "=STDEV.S( Range of data set)" in Excel to obtain the standard deviation of the sample. The answer obtained is 10.5225.
The snips are as follows;
Hence, now we have
The null hypothesis states that mean is equal to 20, whereas the alternative hypothesis states that mean is greater than 20. Symbolically it is represented as,
Hence, we see that it is right tailed test.
NOTE: As the population standard deviation is not provided, we will use the t-test, because t-test is executed when the population standard deviation is unknown.
The formula and calculations for the t-test statistic is as follows;
Now, we need to calculate the degrees of freedom. It is calculated as;
df=n-1=20-1=19
We have significance level, i.e,
Now, we need to obtain the p-value. Observe t=1.81 and df=19 in the t-statistical table to obtain the p-value.
For left tailed, The answer obtained is 0.0431.
The decision rule states that if the p-value is less than the significance level, then we reject the null hypothesis.
In this case, 0.0431<0.05, hence we Reject the null hypothesis.
It is then concluded that the mean of the positive signals is more than 20.

Step by step
Solved in 2 steps with 2 images


