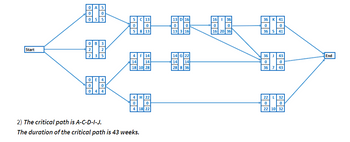
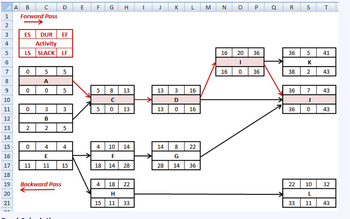
Nikos Anastopoulos of EMPROSS Strategic IT Consultants, leads the development of a new football stadium. He developed the activities, durations, and predecessor relationships in the following table for delivering company valuations. Activity A B с D E F G H I J K L Predecessor A, B с E F E D D, G, I I H Duration in Weeks 5 3 8 3 4 10 8 18 20 7 5 10
can someone help me with this one


Step by step
Solved in 4 steps with 6 images

one thing i dont understand is when i asked the first question the precedence graph looks very different to the one for the third time i asked question satrting with 6C.
in the picture it shows the difference between the two the answer is both the same 41 weeks.
please chack the the first time i asked the question and then the third time i asked the graphs look different


6C. Change the time of at least two activities that can reduce the overall project duration, draw the new critical path and the new Gantt chart.
First: Repeat 6B by changing the task time of any 2 or 3 tasks that will result in a smaller project duration.
Please note that changing only terminal tasks (ending tasks) will not give you any credit as it is easy to reduce the duration of the project by changing the duration of the last task.
To make the reduced task time more visible you can colour them RED and write about them.
Second: identify the critical part and explain it. Explain if the critical path has changed and why? or why not?
Third: Explain your answer for the new (shorter) project duration. This can be done by describing the process and the observations done once the answer has been found.
Fourth: Draw the new project’s Gantt chart
Fifth: Explain the Gantt chart by emphasizing the observations made. State your conclusions.
thank you
Draw the project’s Gantt chart
-First: The project’s Gantt chart needs to be done.
-Second: Explain the Gantt chart by emphasizing the observations made. State your conclusions.


