On the graph, label your starting AD line as AD 2019. Draw a new AD line showing the change to AD due to the pandemic. Label your starting SRAS line as SRAS 2019. Draw a new SRAS line showing the change to supply due to the pandemic.Label the new short-run equilibrium RGDP and Price Level. Does output (i.e. RGDP) increase or decrease in your model? Does the price level increase or decrease in your model? According to the AD-AS model when RGDP falls the unemployment rises and vice versa. Does your graph indicate an increase or decrease in the unemployment rate
On the graph, label your starting AD line as AD 2019. Draw a new AD line showing the change to AD due to the pandemic. Label your starting SRAS line as SRAS 2019. Draw a new SRAS line showing the change to supply due to the pandemic.Label the new short-run equilibrium RGDP and Price Level. Does output (i.e. RGDP) increase or decrease in your model? Does the price level increase or decrease in your model? According to the AD-AS model when RGDP falls the unemployment rises and vice versa. Does your graph indicate an increase or decrease in the unemployment rate

Chapter1: Making Economics Decisions
Section: Chapter Questions
Problem 1QTC

Related questions
Question
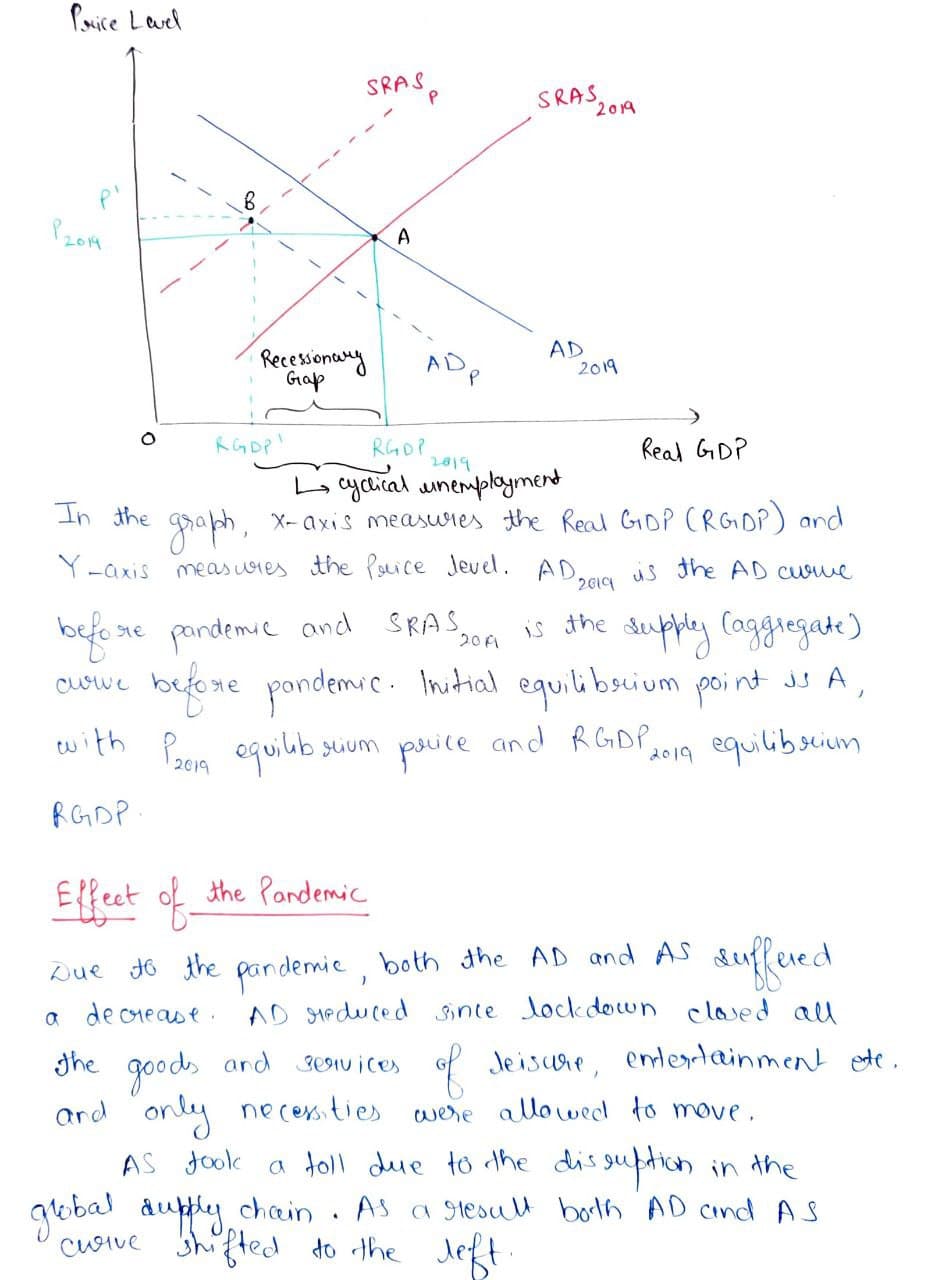
On the graph, label your starting AD line as AD 2019. Draw a new AD line showing the change to AD due to the pandemic. Label your starting SRAS line as SRAS 2019. Draw a new SRAS line showing the change to supply due to the pandemic.Label the new short-run equilibrium RGDP and Price Level.
- Does output (i.e. RGDP) increase or decrease in your model?
- Does the price level increase or decrease in your model?
- According to the AD-AS model when RGDP falls the
unemployment rises and vice versa. Does your graph indicate an increase or decrease in the unemployment rate

Transcribed Image Text:Average
Price level
SRAS
AD
Y
Output
P.

Transcribed Image Text:FRED
- Consumer Price Index for All Urban Consumers: All Items in U.S. City Average
2.5
2.0
1.5
1.0
0.5
0.0
-0.5
-1.0
Q2 2019
Q3 2019
Q4 2019
Q1 2020
Q2 2020
Q3 2020
Q4 2020
Q1 2021
Q2 2021
Q3 2021
Q4 2021
Percent Change of (Index 1982-1984=100)
Expert Solution
Step 1 Introduction

Trending now
This is a popular solution!

Step by step
Solved in 2 steps with 2 images

Knowledge Booster


Learn more about
Need a deep-dive on the concept behind this application? Look no further. Learn more about this topic, economics and related others by exploring similar questions and additional content below.Recommended textbooks for you

Principles of Economics (12th Edition)
Economics
ISBN:
9780134078779
Author:
Karl E. Case, Ray C. Fair, Sharon E. Oster
Publisher:
PEARSON

Engineering Economy (17th Edition)
Economics
ISBN:
9780134870069
Author:
William G. Sullivan, Elin M. Wicks, C. Patrick Koelling
Publisher:
PEARSON
Principles of Economics (12th Edition)
Economics
ISBN:
9780134078779
Author:
Karl E. Case, Ray C. Fair, Sharon E. Oster
Publisher:
PEARSON
Engineering Economy (17th Edition)
Economics
ISBN:
9780134870069
Author:
William G. Sullivan, Elin M. Wicks, C. Patrick Koelling
Publisher:
PEARSON

Principles of Economics (MindTap Course List)
Economics
ISBN:
9781305585126
Author:
N. Gregory Mankiw
Publisher:
Cengage Learning

Managerial Economics: A Problem Solving Approach
Economics
ISBN:
9781337106665
Author:
Luke M. Froeb, Brian T. McCann, Michael R. Ward, Mike Shor
Publisher:
Cengage Learning

Managerial Economics & Business Strategy (Mcgraw-…
Economics
ISBN:
9781259290619
Author:
Michael Baye, Jeff Prince
Publisher:
McGraw-Hill Education