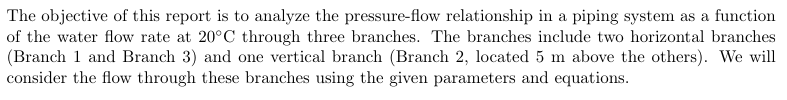
On a single plot, show curves that show the relationship between the pressure generated by the pump as a function of flow rate of water at 20 °C through the three branches of the piping system shown below (delta P on the y axis and flow rate on the x axis; the range of the pressure should be 0 to ~1 MPa). Pipe inner diameter: 0.03 m Pipe material: copper Typical mass flow rate of interest: 0.5 kg/s Ignore minor losses of tee's at points A and B and any features of branch 3 Consider minor losses of two 90° elbows in branch 2
On a single plot, show curves that show the relationship between the pressure generated by the pump as a function of flow rate of water at 20 °C through the three branches of the piping system shown below (delta P on the y axis and flow rate on the x axis; the range of the pressure should be 0 to ~1 MPa). Pipe inner diameter: 0.03 m Pipe material: copper Typical mass flow rate of interest: 0.5 kg/s Ignore minor losses of tee's at points A and B and any features of branch 3 Consider minor losses of two 90° elbows in branch 2

Elements Of Electromagnetics
7th Edition
ISBN:9780190698614
Author:Sadiku, Matthew N. O.
Publisher:Sadiku, Matthew N. O.
ChapterMA: Math Assessment
Section: Chapter Questions
Problem 1.1MA

Related questions
Question
On a single plot, show curves that show the relationship between the pressure generated by the
pump as a function of flow rate of water at 20 °C through the three branches of the piping system
shown below (delta P on the y axis and flow rate on the x axis; the
range of the pressure should be 0 to ~1 MPa).
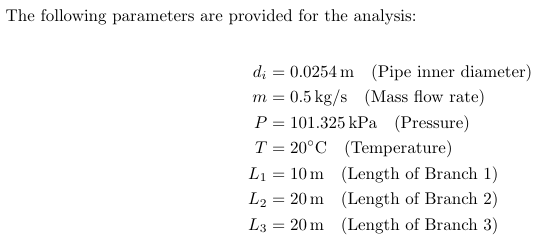
Pipe inner diameter: 0.03 m
Pipe material: copper
Typical mass flow rate of interest: 0.5 kg/s
Ignore minor losses of tee's at points A and B and any features of branch 3
Consider minor losses of two 90° elbows in branch 2

Transcribed Image Text:Pump
A
10 m
Branch 2
Branch 1
20 m from point B to pump
Branch 3
B
5 m
Expert Solution
Step 1: Given data

Step by step
Solved in 7 steps with 10 images

Knowledge Booster


Learn more about
Need a deep-dive on the concept behind this application? Look no further. Learn more about this topic, mechanical-engineering and related others by exploring similar questions and additional content below.Recommended textbooks for you
Elements Of Electromagnetics
Mechanical Engineering
ISBN:
9780190698614
Author:
Sadiku, Matthew N. O.
Publisher:
Oxford University Press

Mechanics of Materials (10th Edition)
Mechanical Engineering
ISBN:
9780134319650
Author:
Russell C. Hibbeler
Publisher:
PEARSON

Thermodynamics: An Engineering Approach
Mechanical Engineering
ISBN:
9781259822674
Author:
Yunus A. Cengel Dr., Michael A. Boles
Publisher:
McGraw-Hill Education
Elements Of Electromagnetics
Mechanical Engineering
ISBN:
9780190698614
Author:
Sadiku, Matthew N. O.
Publisher:
Oxford University Press
Mechanics of Materials (10th Edition)
Mechanical Engineering
ISBN:
9780134319650
Author:
Russell C. Hibbeler
Publisher:
PEARSON
Thermodynamics: An Engineering Approach
Mechanical Engineering
ISBN:
9781259822674
Author:
Yunus A. Cengel Dr., Michael A. Boles
Publisher:
McGraw-Hill Education

Control Systems Engineering
Mechanical Engineering
ISBN:
9781118170519
Author:
Norman S. Nise
Publisher:
WILEY

Mechanics of Materials (MindTap Course List)
Mechanical Engineering
ISBN:
9781337093347
Author:
Barry J. Goodno, James M. Gere
Publisher:
Cengage Learning

Engineering Mechanics: Statics
Mechanical Engineering
ISBN:
9781118807330
Author:
James L. Meriam, L. G. Kraige, J. N. Bolton
Publisher:
WILEY