Old Ballplayers. From the ESPNWeb site, we obtained the age of the oldest player on each of the major league baseball teams during one season. Here are the data. 33 37 36 40 36 36 40 36 37 36 40 42 37 42 38 39 35 37 40 44 39 40 46 38 37 40 37 42 41 41 a. Construct a dotplot for these data.b. Use your dotplot from part (a) to identify the modality and symmetry (or nonsymmetry) of the distribution of these ages.


Old Ballplayers. From the ESPNWeb site, we obtained the age of the oldest player on each of the major league baseball teams during one season. Here are the data.
| 33 | 37 | 36 | 40 | 36 | 36 |
| 40 | 36 | 37 | 36 | 40 | 42 |
| 37 | 42 | 38 | 39 | 35 | 37 |
| 40 | 44 | 39 | 40 | 46 | 38 |
| 37 | 40 | 37 | 42 | 41 | 41 |
a. Construct a dotplot for these data.
b. Use your dotplot from part (a) to identify the modality and symmetry (or nonsymmetry) of the distribution of these ages.
Note: In this case software usage is not mentioned. MINITAB software is used to obtain the dot plot.
Dot plot:
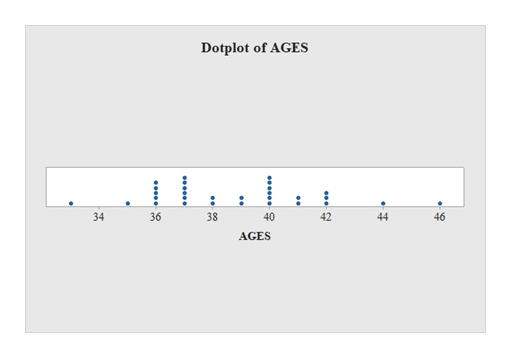
Interpretation:
The dot plot is constructed by locate the original values of the data set as a dot over the horizontal axis
Thus all possible set of values related to the dot plot is displayed in the horizontal axis and from the dot plot it is observed that the data is arranged from lowest value to the highest values. Also, the data is more in between the of 36 to 40 values.

Trending now
This is a popular solution!

Step by step
Solved in 4 steps with 1 images


