Oil Production in Mexico The following graph shows approximate daily oil production by a country's national oil company in millions of barrels per day, where t is the time in years since 2000. Also shown is the tangent line at the point corresponding to year 2008. Oil production P(t) 4.3 3.9 3.5 3.26 8 9 10 11 Ⓡ (a) Estimate the slope of the tangent line shown on the graph. HINT [Identify two points on the tangent line.] (Round your answer to two decimal places.) What does the graph tell you about oil production by the country's national oil company in 2008? In 2008, daily oil production by the country's national oil company was million barrels and decreasing at a rate of million barrels per year. (b) According to the graph, is the rate of change of oil production by the country's national oil company increasing or decreasing over the range [6, 9]? Why? O The rate of change is decreasing over the range [6, 9], since the function is decreasing. O The rate of change is decreasing over the range [6, 9], since the slope is increasing. O The rate of change is increasing over the range [6, 9], since the function is increasing. O The rate of change is decreasing over the range [6, 9], since the slope is decreasing. O The rate of change is increasing over the range [6, 9], since the slope is decreasing. O The rate of change is increasing over the range [6, 9], since the slope is increasing.
Oil Production in Mexico The following graph shows approximate daily oil production by a country's national oil company in millions of barrels per day, where t is the time in years since 2000. Also shown is the tangent line at the point corresponding to year 2008. Oil production P(t) 4.3 3.9 3.5 3.26 8 9 10 11 Ⓡ (a) Estimate the slope of the tangent line shown on the graph. HINT [Identify two points on the tangent line.] (Round your answer to two decimal places.) What does the graph tell you about oil production by the country's national oil company in 2008? In 2008, daily oil production by the country's national oil company was million barrels and decreasing at a rate of million barrels per year. (b) According to the graph, is the rate of change of oil production by the country's national oil company increasing or decreasing over the range [6, 9]? Why? O The rate of change is decreasing over the range [6, 9], since the function is decreasing. O The rate of change is decreasing over the range [6, 9], since the slope is increasing. O The rate of change is increasing over the range [6, 9], since the function is increasing. O The rate of change is decreasing over the range [6, 9], since the slope is decreasing. O The rate of change is increasing over the range [6, 9], since the slope is decreasing. O The rate of change is increasing over the range [6, 9], since the slope is increasing.

Advanced Engineering Mathematics
10th Edition
ISBN:9780470458365
Author:Erwin Kreyszig
Publisher:Erwin Kreyszig
Chapter2: Second-order Linear Odes
Section: Chapter Questions
Problem 1RQ

Related questions
Question
![Oil Production in Mexico The following graph shows approximate daily oil production by a country's national oil company in millions of barrels per day, where t is the time in years since 2000. Also shown is the tangent line at the point corresponding to year 2008.
Oil production
P(t)
4.3
3.9
3.5
3.1
7
3.26
8
9
10
11
t
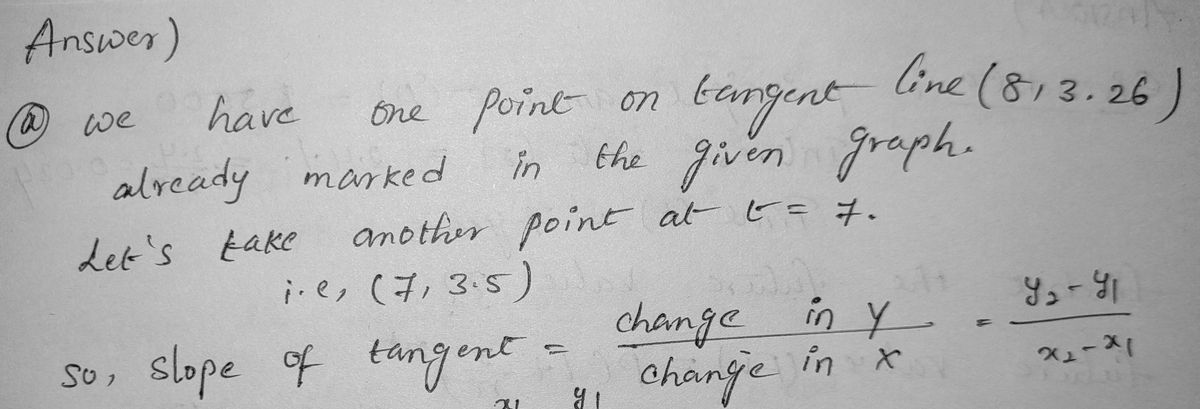
(a) Estimate the slope of the tangent line shown on the graph. HINT [Identify two points on the tangent line.] (Round your answer to two decimal places.)
What does the graph tell you about oil production by the country's national oil company in 2008?
In 2008, daily oil production by the country's national oil company was
million barrels and decreasing at a rate of
million barrels per year.
(b) According to the graph, is the rate of change of oil production by the country's national oil company increasing or decreasing over the range [6, 9]? Why?
O The rate of change is decreasing over the range [6, 9], since the function is decreasing.
O The rate of change is decreasing over the range [6, 9], since the slope is increasing.
O The rate of change is increasing over the range [6, 9], since the function is increasing.
O The rate of change is decreasing over the range [6, 9], since the slope is decreasing.
O The rate of change is increasing over the range [6, 9], since the slope is decreasing.
O The rate of change is increasing over the range [6, 9], since the slope is increasing.](/v2/_next/image?url=https%3A%2F%2Fcontent.bartleby.com%2Fqna-images%2Fquestion%2F8e4df10b-736d-4137-83ee-4d7795b0dffe%2Fa9457184-3b7a-4374-8f71-818e3114d31f%2Fvphzwuu_processed.png&w=3840&q=75)
Transcribed Image Text:Oil Production in Mexico The following graph shows approximate daily oil production by a country's national oil company in millions of barrels per day, where t is the time in years since 2000. Also shown is the tangent line at the point corresponding to year 2008.
Oil production
P(t)
4.3
3.9
3.5
3.1
7
3.26
8
9
10
11
t
(a) Estimate the slope of the tangent line shown on the graph. HINT [Identify two points on the tangent line.] (Round your answer to two decimal places.)
What does the graph tell you about oil production by the country's national oil company in 2008?
In 2008, daily oil production by the country's national oil company was
million barrels and decreasing at a rate of
million barrels per year.
(b) According to the graph, is the rate of change of oil production by the country's national oil company increasing or decreasing over the range [6, 9]? Why?
O The rate of change is decreasing over the range [6, 9], since the function is decreasing.
O The rate of change is decreasing over the range [6, 9], since the slope is increasing.
O The rate of change is increasing over the range [6, 9], since the function is increasing.
O The rate of change is decreasing over the range [6, 9], since the slope is decreasing.
O The rate of change is increasing over the range [6, 9], since the slope is decreasing.
O The rate of change is increasing over the range [6, 9], since the slope is increasing.
Expert Solution
Step 1

Step by step
Solved in 2 steps with 2 images

Recommended textbooks for you
Advanced Engineering Mathematics
Advanced Math
ISBN:
9780470458365
Author:
Erwin Kreyszig
Publisher:
Wiley, John & Sons, Incorporated

Numerical Methods for Engineers
Advanced Math
ISBN:
9780073397924
Author:
Steven C. Chapra Dr., Raymond P. Canale
Publisher:
McGraw-Hill Education

Introductory Mathematics for Engineering Applicat…
Advanced Math
ISBN:
9781118141809
Author:
Nathan Klingbeil
Publisher:
WILEY
Advanced Engineering Mathematics
Advanced Math
ISBN:
9780470458365
Author:
Erwin Kreyszig
Publisher:
Wiley, John & Sons, Incorporated
Numerical Methods for Engineers
Advanced Math
ISBN:
9780073397924
Author:
Steven C. Chapra Dr., Raymond P. Canale
Publisher:
McGraw-Hill Education
Introductory Mathematics for Engineering Applicat…
Advanced Math
ISBN:
9781118141809
Author:
Nathan Klingbeil
Publisher:
WILEY

Mathematics For Machine Technology
Advanced Math
ISBN:
9781337798310
Author:
Peterson, John.
Publisher:
Cengage Learning,

