The median weekly earnings for 16-24-year-old men employed full time are given below. Median Weekly Earnings in Constant 2008 Dollars Year 2000 2002 2003 2004 2005 2006 2008 Earnings, s (dollars) 375 391 398 400 409 418 461 (a) Why is a cubic model a reasonable choice for the data? A scatter plot of the data suggests a cubic function because it is increasing and is concave down before 2004 and concave up after 2004. O A scatter plot of the data suggests a cubic function because it is decreasing and is concave up before 2004 and concave down after 2004. OA scatter plot of the data suggests a cubic function because it is decreasing and is concave down before 2004 and concave up after 2004. OA scatter plot of the data suggests a cubic function because it is increasing and is concave up before 2004 and concave down after 2004. ✓ (b) Write a model for the weekly salary of 16-24-year-old men in constant 2008 dollars. (Be sure to use t as the independent variable. Align the input data so that t= 0 in 2000. Round all numerical values to three decimal places.) s(t) = -Select--- gives the median weekly salary of 16-24 year old men employed full-time -Select-- since 2000, 0 st≤ 8. x (c) Use the unrounded model to estimate the median weekly earnings for 16-24-year-old men in 2015. (Round your answer to the nearest dollar.) $ (d) What type of estimation was made in part (c)? O extrapolation O interpolation
The median weekly earnings for 16-24-year-old men employed full time are given below. Median Weekly Earnings in Constant 2008 Dollars Year 2000 2002 2003 2004 2005 2006 2008 Earnings, s (dollars) 375 391 398 400 409 418 461 (a) Why is a cubic model a reasonable choice for the data? A scatter plot of the data suggests a cubic function because it is increasing and is concave down before 2004 and concave up after 2004. O A scatter plot of the data suggests a cubic function because it is decreasing and is concave up before 2004 and concave down after 2004. OA scatter plot of the data suggests a cubic function because it is decreasing and is concave down before 2004 and concave up after 2004. OA scatter plot of the data suggests a cubic function because it is increasing and is concave up before 2004 and concave down after 2004. ✓ (b) Write a model for the weekly salary of 16-24-year-old men in constant 2008 dollars. (Be sure to use t as the independent variable. Align the input data so that t= 0 in 2000. Round all numerical values to three decimal places.) s(t) = -Select--- gives the median weekly salary of 16-24 year old men employed full-time -Select-- since 2000, 0 st≤ 8. x (c) Use the unrounded model to estimate the median weekly earnings for 16-24-year-old men in 2015. (Round your answer to the nearest dollar.) $ (d) What type of estimation was made in part (c)? O extrapolation O interpolation

Algebra & Trigonometry with Analytic Geometry
13th Edition
ISBN:9781133382119
Author:Swokowski
Publisher:Swokowski
Chapter7: Analytic Trigonometry
Section7.6: The Inverse Trigonometric Functions
Problem 94E

Related questions
Question

Transcribed Image Text:The median weekly earnings for 16-24-year-old men employed full time are given below.
Median Weekly Earnings in Constant
2008 Dollars
Year
2000
2002
2003
2004
2005
2006
2008
Earnings, s
(dollars)
375
391
398
400
409
418
461
(a) Why is a cubic model a reasonable choice for the data?
A scatter plot of the data suggests a cubic function because it is increasing and is concave down before 2004 and concave up after 2004.
O A scatter plot of the data suggests a cubic function because it is decreasing and is concave up before 2004 and concave down after 2004.
O A scatter plot of the data suggests a cubic function because it is decreasing and is concave down before 2004 and concave up after 2004.
O A scatter plot of the data suggests a cubic function because it is increasing and is concave up before 2004 and concave down after 2004.
(b) Write a model for the weekly salary of 16-24-year-old men in constant 2008 dollars. (Be sure to use t as the independent variable. Align the input data so that t = 0 in 2000. Round all numerical values to three decimal places.)
s(t) =
--Select--- gives the median weekly salary of 16-24 year old men employed full-time --Select-- since 2000, 0 st≤ 8.
X
(c) Use the unrounded model to estimate the median weekly earnings for 16-24-year-old men in 2015. (Round your answer to the nearest dollar.)
$
(d) What type of estimation was made in part (c)?
O extrapolation
O interpolation
4
Expert Solution
Step 1
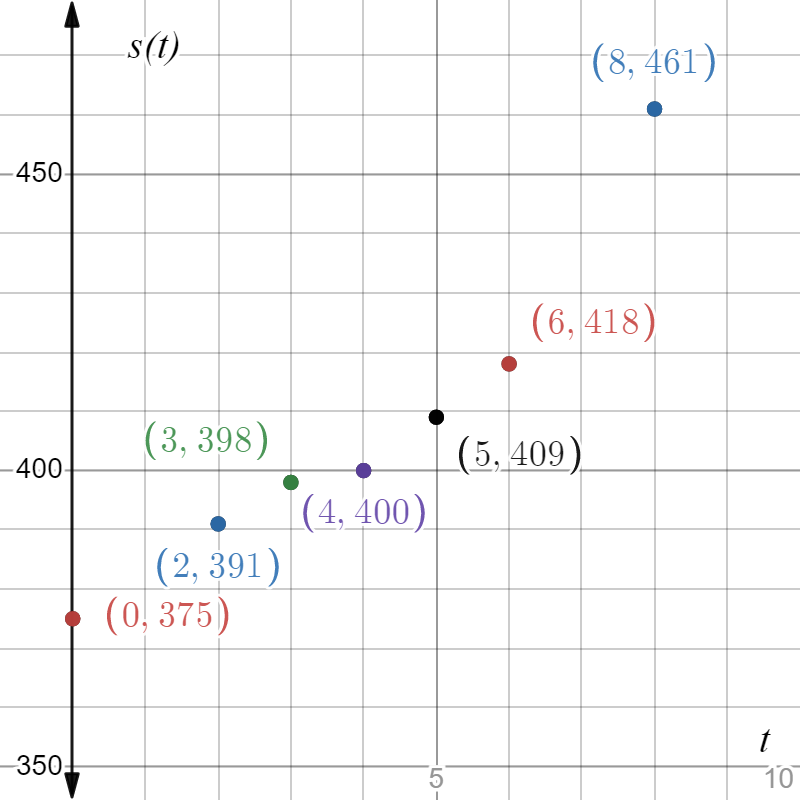
Given is a dataset for median weekly earning of a 16-24 year old men, employed full-time.
Consider the year to be as the initial year. So in .
Then the given dataset is as below:
| 0 | 2 | 3 | 4 | 5 | 6 | 8 | |
| 375 | 391 | 398 | 400 | 409 | 418 | 461 |
Now plot the data set according to the given set of numbers considering the -axis as and -axis as .

Trending now
This is a popular solution!

Step by step
Solved in 4 steps with 2 images

Recommended textbooks for you
Algebra & Trigonometry with Analytic Geometry
Algebra
ISBN:
9781133382119
Author:
Swokowski
Publisher:
Cengage


Trigonometry (MindTap Course List)
Trigonometry
ISBN:
9781337278461
Author:
Ron Larson
Publisher:
Cengage Learning
Algebra & Trigonometry with Analytic Geometry
Algebra
ISBN:
9781133382119
Author:
Swokowski
Publisher:
Cengage
Trigonometry (MindTap Course List)
Trigonometry
ISBN:
9781337278461
Author:
Ron Larson
Publisher:
Cengage Learning


Big Ideas Math A Bridge To Success Algebra 1: Stu…
Algebra
ISBN:
9781680331141
Author:
HOUGHTON MIFFLIN HARCOURT
Publisher:
Houghton Mifflin Harcourt

College Algebra (MindTap Course List)
Algebra
ISBN:
9781305652231
Author:
R. David Gustafson, Jeff Hughes
Publisher:
Cengage Learning