of the two ts represented s shown. t are ich of this fast, bol. dents will (29. Performance Task Use the table to answer the questions. THE DAILY NEWS NEWSPAPERS DECLINING! Daily Newspapers My in U.S. 1,878 1,772 1,763 1,748 1,745 1,611 Year 1940 1950 1960 1970 1980 1990 2000 2010 1,480 1,382 ww Part A Use technology to determine the equation for the line of best fit and the correlation coefficient for the data from 1940 through 1980. 246 Vand Part B Find the line of best fit and the correlation coefficient for the data from 1940 through 2010. Part C Compare the correlation coefficients of the two data sets. What do they indicate? 2015
of the two ts represented s shown. t are ich of this fast, bol. dents will (29. Performance Task Use the table to answer the questions. THE DAILY NEWS NEWSPAPERS DECLINING! Daily Newspapers My in U.S. 1,878 1,772 1,763 1,748 1,745 1,611 Year 1940 1950 1960 1970 1980 1990 2000 2010 1,480 1,382 ww Part A Use technology to determine the equation for the line of best fit and the correlation coefficient for the data from 1940 through 1980. 246 Vand Part B Find the line of best fit and the correlation coefficient for the data from 1940 through 2010. Part C Compare the correlation coefficients of the two data sets. What do they indicate? 2015
Algebra and Trigonometry (6th Edition)
6th Edition
ISBN:9780134463216
Author:Robert F. Blitzer
Publisher:Robert F. Blitzer
ChapterP: Prerequisites: Fundamental Concepts Of Algebra
Section: Chapter Questions
Problem 1MCCP: In Exercises 1-25, simplify the given expression or perform the indicated operation (and simplify,...
Related questions
Question

Transcribed Image Text:of the two
ts represented
Is shown.
st are
ich of
this
fast,
pol.
Je
n
dents will
29. Performance Task Use the table to answer
the questions.
THE DAILY NEWS
NEWSPAPERS DECLINING!
The decline of newspapers has
been w dely debated as the
ndustry has faced down saat he
hewsplint pr cet slumping ad
sales the loss of much classified
advent sing and prec bitavi
drop: herculation in recent
years the number of
newspapers slated for klature
bankruptcy at sevate cutbacks
has risen especially in the
Un ted States where the
ndustry has shed a fifth of
journalsts since 2001
Year
1940
1950
1960
1970
1980
1990
2000
2010
Daily
Newspapers
in U.S.
1,878
1,772
1,763
1,748
1,745
1,611
1,480
1,382
D
Revenue has plunged wh le
compet tion from internet
me a ha: squeezed older pr
publishers This has strictly
affected only the United States
at the English speaking market:
though there is a large fise in
sales for countries like China
Japan and India
S
The debate has become more
urgent lately a: deepening
recession has cvt profits and 3:
once explosive growth n
newspaper web revenues ha:
leveled off forestall ng what the
ndustry haped would become
an mportant source of revenve
One issue 12 whether the
newspaper industry is being hit
by a cyclical trough and will
recover ar whether new
Techralagy has tendered
newspapers abralete in the
Part A Use technology to determine the
equation for the line of best fit and the
correlation coefficient for the data from 1940
through 1980.
Part B Find the line of best fit and the
correlation coefficient for the data from
1940 through 2010.
Part C Compare the correlation coefficients of
the two data sets. What do they indicate?
Expert Solution
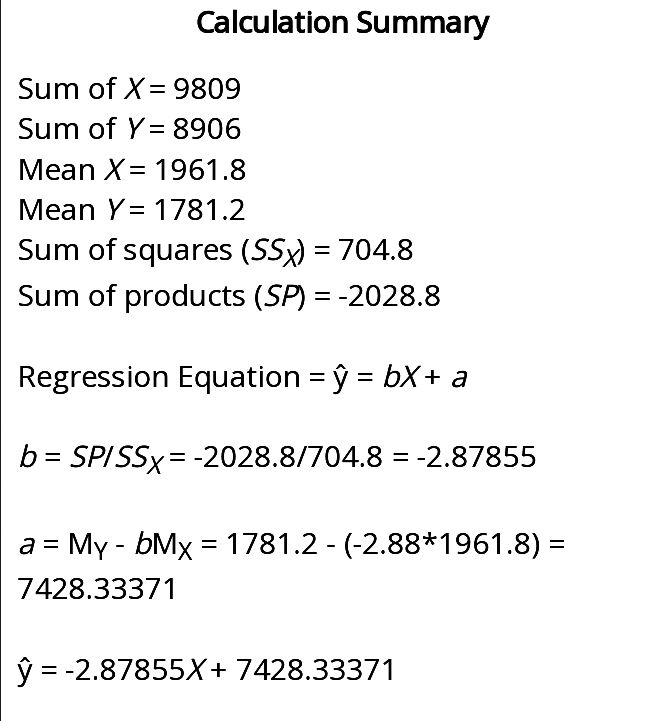
Step 1: Part A) line of best fit and correlation coefficient from 1940 to 1980
By using graphing calculator

Step by step
Solved in 7 steps with 6 images

Recommended textbooks for you

Algebra and Trigonometry (6th Edition)
Algebra
ISBN:
9780134463216
Author:
Robert F. Blitzer
Publisher:
PEARSON

Contemporary Abstract Algebra
Algebra
ISBN:
9781305657960
Author:
Joseph Gallian
Publisher:
Cengage Learning

Linear Algebra: A Modern Introduction
Algebra
ISBN:
9781285463247
Author:
David Poole
Publisher:
Cengage Learning

Algebra and Trigonometry (6th Edition)
Algebra
ISBN:
9780134463216
Author:
Robert F. Blitzer
Publisher:
PEARSON

Contemporary Abstract Algebra
Algebra
ISBN:
9781305657960
Author:
Joseph Gallian
Publisher:
Cengage Learning

Linear Algebra: A Modern Introduction
Algebra
ISBN:
9781285463247
Author:
David Poole
Publisher:
Cengage Learning

Algebra And Trigonometry (11th Edition)
Algebra
ISBN:
9780135163078
Author:
Michael Sullivan
Publisher:
PEARSON

Introduction to Linear Algebra, Fifth Edition
Algebra
ISBN:
9780980232776
Author:
Gilbert Strang
Publisher:
Wellesley-Cambridge Press

College Algebra (Collegiate Math)
Algebra
ISBN:
9780077836344
Author:
Julie Miller, Donna Gerken
Publisher:
McGraw-Hill Education