nterpret data visualization consisting of such tools as time series plots, box plots, and scatter charts using the following data sets. Scatter charts (X versus Y) – Analyze two different and distinct relationships: C22 (X, monthly advertising dollars) versus C23 (Y, monthly revenue dollars), Please indicate Equation, Slope, Intercept, R^2 value, 95% confidence, and P-value using regression in Excel and scatter graph. Is it significant? DO I reject the


Interpret data visualization consisting of such tools as time series plots, box plots, and scatter charts using the following data sets.
Scatter charts (X versus Y) – Analyze two different and distinct relationships: C22 (X, monthly advertising dollars) versus C23 (Y, monthly revenue dollars),
Please indicate Equation, Slope, Intercept, R^2 value, 95% confidence, and P-value using regression in Excel and scatter graph. Is it significant? DO I reject the hypothesis?
| C22 | C23 |
| 12000 | 101000 |
| 8000 | 92000 |
| 10000 | 110000 |
| 13000 | 120000 |
| 7000 | 90000 |
| 8000 | 82000 |
| 10000 | 93000 |
| 6000 | 75000 |
| 9000 | 91000 |
| 11000 | 105000 |
| SUMMARY OUTPUT | ||||||||
| Regression Statistics | ||||||||
| Multiple R | 0.87544177 | |||||||
| R Square | 0.766398293 | |||||||
| Adjusted R Square | 0.737198079 | |||||||
| Standard Error | 6837.15011 | |||||||
| Observations | 10 | |||||||
| ANOVA | ||||||||
| df | SS | MS | F | Significance F | ||||
| Regression | 1 | 1226927027.02703000 | 1226927027.02703000 | 26.24633 | 0.00090371 | |||
| Residual | 8 | 373972972.97297300 | 46746621.62162160 | |||||
| Total | 9 | 1600900000.00000000 | ||||||
| Coefficients | Standard Error | t Stat | P-value | Lower 95% | Upper 95% | Lower 95.0% | Upper 95.0% | |
| Intercept | 46486.48649 | 9884.566283 | 4.702936392 | 0.001536 | 23692.6358 | 69280.33721 | 23692.63576 | 69280.33721 |
Hello! As you have posted more than 3 sub parts, we are answering the first 3 sub-parts. In case you require the unanswered parts also, kindly re-post that parts separately.
Steps to construct scatter plot: Linear
- Enter the data for C22 and C23 in Excel sheet
- Select the columns of C22 and C23 values.
- Go to Insert menu.
- Click on “Insert scatter or bubble chart” option.
- Select Scatter under Charts.
Excel Output:
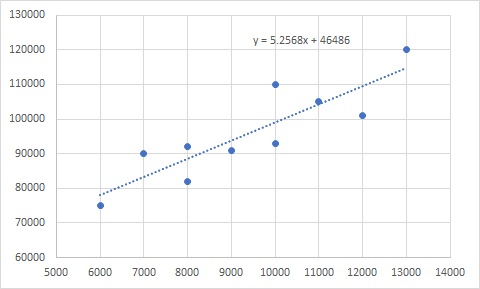
From the scatter plot, there exists a positive linear relationship between monthly advertising dollars and monthly revenue dollars

Step by step
Solved in 3 steps with 4 images


