Now use a repeated-measures t-test with α =.05 to evaluate the mean difference between treatments. t-critical=± t=
Now use a repeated-measures t-test with α =.05 to evaluate the mean difference between treatments. t-critical=± t=

MATLAB: An Introduction with Applications
6th Edition
ISBN:9781119256830
Author:Amos Gilat
Publisher:Amos Gilat
Chapter1: Starting With Matlab
Section: Chapter Questions
Problem 1P

Related questions
Topic Video
Question
Now use a repeated-measures t-test with α =.05 to evaluate the mean difference between treatments.
t-critical=±
t=

Transcribed Image Text:# Statistical Analysis Table Explanation
## Data Overview
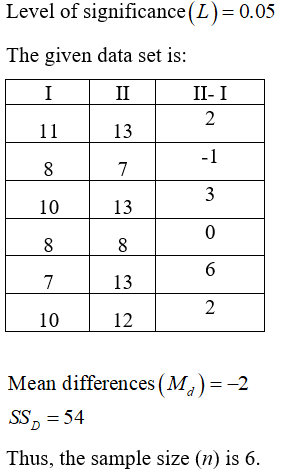
This table displays data from a study where six persons (A-F) were subjected to two different treatments (I and II). The table includes individual scores for each treatment, their totals, and the differences between the scores of Treatment II and Treatment I. Additionally, means, totals, and sum of squares are calculated for various sections.
### Columns and Rows Description
1. **Treatment Person:** This row lists the six individuals taking part in the study, denoted from A to F.
2. **Scores under Treatment I and II:**
- **I (Treatment I):** The scores each person received under Treatment I.
- **II (Treatment II):** The scores each person received under Treatment II.
3. **Totals:** The sum of each individual's scores from Treatments I and II.
4. **Differences (II-I):** The difference between each individual's scores in Treatment II and Treatment I, denoted as (II - I).
5. **Mean, Total, and Sum of Squares:**
- **Mean:** The average score for each treatment.
- **M=9** for Treatment I.
- **M=11** for Treatment II.
- **M=20** for Totals.
- **Total:** The sum of all scores.
- **T=54** for Treatment I.
- **T=66** for Treatment II.
- **G=120** for Totals.
- **Sum of Squares (SS):** Represents the dispersion of data points.
- **SS=498** for Treatment I.
- **SS=764** for Treatment II.
- **ΣXᵢ² = 2470** for Totals.
- **Differences:**
- **ΣD=12**: The sum of all differences.
- **SSD=54**: The sum of squared differences.
### Detailed Cells Description
1. **Scores for Each Person:**
- **A:**
- Treatment I: 11
- Treatment II: 13
- Total: 24
- Difference: 2
- **B:**
- Treatment I: 8
- Treatment II: 7
- Total: 15
- Difference: -1
- **C:**
- Treatment I: 10
- Treatment
Expert Solution
Step 1
It is given that:
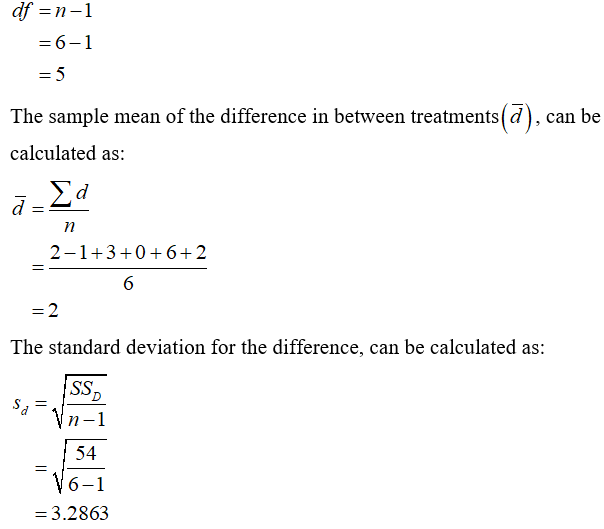
Step 2
The degree of freedom can be calculated as:

Step by step
Solved in 4 steps with 4 images

Knowledge Booster


Learn more about
Need a deep-dive on the concept behind this application? Look no further. Learn more about this topic, statistics and related others by exploring similar questions and additional content below.Recommended textbooks for you
MATLAB: An Introduction with Applications
Statistics
ISBN:
9781119256830
Author:
Amos Gilat
Publisher:
John Wiley & Sons Inc

Probability and Statistics for Engineering and th…
Statistics
ISBN:
9781305251809
Author:
Jay L. Devore
Publisher:
Cengage Learning

Statistics for The Behavioral Sciences (MindTap C…
Statistics
ISBN:
9781305504912
Author:
Frederick J Gravetter, Larry B. Wallnau
Publisher:
Cengage Learning
MATLAB: An Introduction with Applications
Statistics
ISBN:
9781119256830
Author:
Amos Gilat
Publisher:
John Wiley & Sons Inc
Probability and Statistics for Engineering and th…
Statistics
ISBN:
9781305251809
Author:
Jay L. Devore
Publisher:
Cengage Learning
Statistics for The Behavioral Sciences (MindTap C…
Statistics
ISBN:
9781305504912
Author:
Frederick J Gravetter, Larry B. Wallnau
Publisher:
Cengage Learning

Elementary Statistics: Picturing the World (7th E…
Statistics
ISBN:
9780134683416
Author:
Ron Larson, Betsy Farber
Publisher:
PEARSON

The Basic Practice of Statistics
Statistics
ISBN:
9781319042578
Author:
David S. Moore, William I. Notz, Michael A. Fligner
Publisher:
W. H. Freeman

Introduction to the Practice of Statistics
Statistics
ISBN:
9781319013387
Author:
David S. Moore, George P. McCabe, Bruce A. Craig
Publisher:
W. H. Freeman