Now assume that the data are from a repeated- measures study using the same sample of n = 6 participants in all three treatment conditions. Use a repeated-measures ANOVA with α = .05 to test the significance of the mean differences. (follow the four-step procedure) B) Compute partial eta square for part A. Report your results of the hypothesis test and effect size in APA format C) Conduct a post hoc analysis for part A using HSD


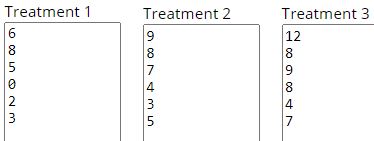
The following data are from an experiment comparing three different treatment conditions
|
|
Treatment |
|
|
|
|
|
I |
II |
III |
P |
|
|
|
6 |
9 |
12 |
27 |
N = 18 |
|
|
8 |
8 |
8 |
24 |
G = 108 |
|
|
5 |
7 |
9 |
21 |
ΣX2 = 800 |
|
|
0 |
4 |
8 |
12 |
|
|
|
2 |
3 |
4 |
9 |
|
|
|
3 |
5 |
7 |
15 |
|
|
|
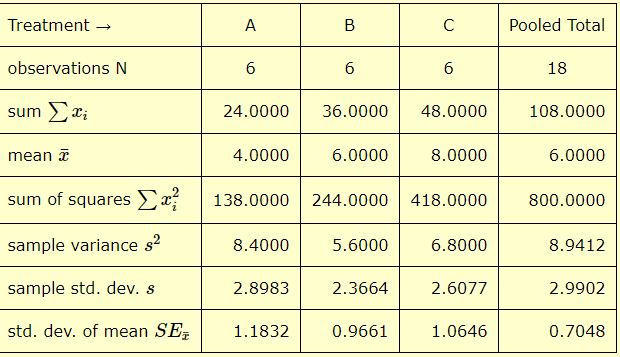
M = 4 |
M = 6 |
M = 8 |
|
|
|
|
T = 24 |
T = 36 |
T = 48 |
|
|
|
|
SS =42 |
SS = 28 |
SS = 34 |
|
|
|
A)
Now assume that the data are from a repeated- measures study using the same sample of n = 6 participants in all three treatment conditions. Use a repeated-measures ANOVA with α = .05 to test the significance of the
B)
Compute partial eta square for part A. Report your results of the hypothesis test and effect size in APA format
C)
Conduct a post hoc analysis for part A using HSD
(A)
| Result Details | ||||
| Source |
Sum of Squares SS |
Degree of freedom df | Mean Square MS | F Statistic (The F statistic formula is: F Statistic = variance of the group means / mean of the within group variances) |
| Between-treatments | 48 | 2 | 24 | F = 3.46154 |
| Within-treatments | 104 | 15 | 6.9333 | |
| Total | 152 | 17 | ||
The f-ratio value is 3.46154. The p-value is 0.058066
Hypothesis Results : Conclusion
The p-value corresponding to the F-statistic of one-way ANOVA is higher than 0.05, suggesting that the treatments are not significantly different for that level of significance. The Tukey HSD test, as well as other multiple comparison tests like Scheffe or Bonferroni, might not narrow down which of the pairs of treatments are significantly different.

Trending now
This is a popular solution!

Step by step
Solved in 3 steps with 6 images


