mples: {11, 11, 11, −2}, {11, −8, −2, 11}, {11, −8, 4, −2}, {4, −8, −2, 11}, {−2, −2, −2, 4}, {4, −8, 4, −8}, {11, 4, −8, −2}, {−8, 4, −8, 4}, {−8, −2, −8, 4}, {4, 11, 11, 11}. Complete parts (a) and (b) below.
mples: {11, 11, 11, −2}, {11, −8, −2, 11}, {11, −8, 4, −2}, {4, −8, −2, 11}, {−2, −2, −2, 4}, {4, −8, 4, −8}, {11, 4, −8, −2}, {−8, 4, −8, 4}, {−8, −2, −8, 4}, {4, 11, 11, 11}. Complete parts (a) and (b) below.

A First Course in Probability (10th Edition)
10th Edition
ISBN:9780134753119
Author:Sheldon Ross
Publisher:Sheldon Ross
Chapter1: Combinatorial Analysis
Section: Chapter Questions
Problem 1.1P: a. How many different 7-place license plates are possible if the first 2 places are for letters and...

Related questions
Question
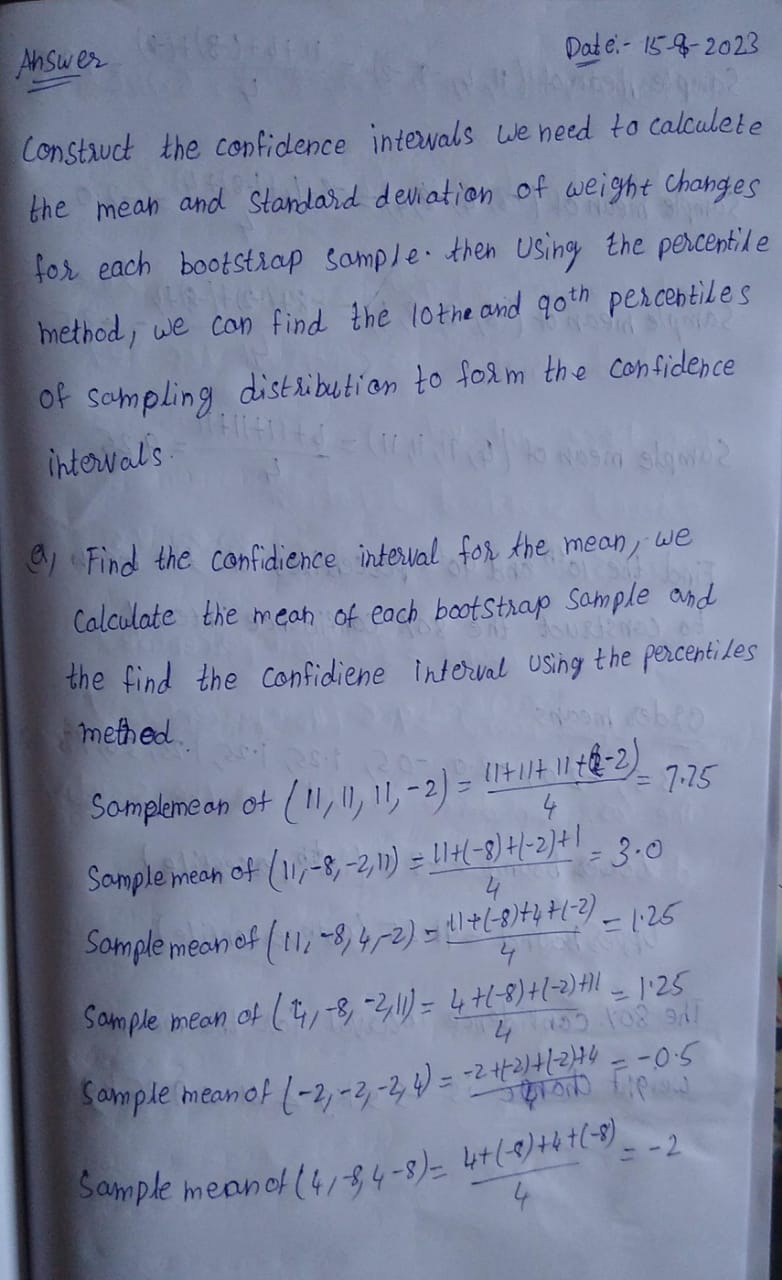
Here is a sample of amounts of weight change (kg) of college students in their freshman year:
11, 4, −2, −8, where −8 represents a loss of 8 kg and positive values represent weight gained. Here are ten bootstrap samples:
{11, 11, 11, −2}, {11, −8, −2, 11}, {11, −8, 4, −2}, {4, −8, −2, 11}, {−2, −2, −2, 4}, {4, −8, 4, −8}, {11, 4, −8, −2}, {−8, 4, −8, 4}, {−8, −2, −8, 4}, {4, 11, 11, 11}.
Complete parts (a) and (b) below.

Transcribed Image Text:9. Here is a sample of amounts of weight change (kg) of college students in their freshman year: 11, 4, -2,
-8, where - 8 represents a loss of 8 kg and positive values represent weight gained. Here are ten
bootstrap samples: (11, 11, 11, -2}, {11, −8, −2, 11}, {11, −8, 4, −2}, {4, -8, -2, 11},
{-2, -2, -2, 4}, {4, −8, 4, −8}, {11, 4, 8, -2}, {-8, 4, 8, 4}, {-8, -2, −8, 4}, {4, 11, 11, 11).
Complete parts (a) and (b) below.
a. Using only the ten given bootstrap samples, construct an 80% confidence interval estimate of the mean
weight change for the population.
kg<μ<
kg
(Round to one decimal place as needed.)
b. Using only the ten given bootstrap samples, construct an 80% confidence interval estimate of the
standard deviation of the weight changes for the population.
kg <s<
kg
(Round to one decimal place as needed.)
Expert Solution
Step 1: Explaina about sample mean

Step by step
Solved in 5 steps with 6 images

Recommended textbooks for you
A First Course in Probability (10th Edition)
Probability
ISBN:
9780134753119
Author:
Sheldon Ross
Publisher:
PEARSON

A First Course in Probability (10th Edition)
Probability
ISBN:
9780134753119
Author:
Sheldon Ross
Publisher:
PEARSON